Vehicle speed monitoring data: July 2023 to September 2025
Summary
Vehicle speed monitoring data July 2023 to September 2025
These statistics provide insights into vehicle speeds recorded at monitoring sites on main through roads across Wales. Monitoring has taken place where a 20mph speed limit now applies. The data summarise vehicle speeds against the three Key Performance Indicators (KPIs) outlined in the national 20mph monitoring framework. The data for the summer 2025 period were collected from 38 monitoring sites on main through roads across 10 areas. Each monitoring period covers two two-week periods of data collection. In each monitoring period, speed data for around 6 million vehicles were collected.
The number of 20mph monitoring sites decreased from 43 to 38 after five sites in Wrexham reverted to a 30mph speed limit. These five sites have been excluded from all periods of KPI analysis. Data for previous periods have been revised to account for this exclusion.
Excluding these sites does not materially affect the overall validity of the results as the remaining sites provide a sufficiently large sample. Overall, the data remain a robust assessment of vehicle speeds where monitoring occurred.
Five 20mph monitoring sites remain in Wrexham. It remains the area with the highest number of vehicles recorded for this dataset , with speeds from 1.2 million vehicles recorded in summer 2025.
The data should not be taken as representative of speeds on all roads with a 20mph speed limit.
Table 1: KPI assessment
| Monitoring period | Percentage travelling at or below 24mph | Weighted 85th percentile speed (mph) | Weighted mean speed (mph) |
|---|---|---|---|
| Summer 2023 | 22.6% | 32.8 | 28.5 |
| Winter 2023/24 | 57.9% | 29.1 | 24.5 |
| Summer 2024 | 52.3% | 29.8 | 25.1 |
| Winter 2024/25 | 53.8% | 29.5 | 24.9 |
| Summer 2025 | 51.5% | 30 | 25.2 |
Vehicle speeds have increased slightly since winter 2024/25 but remain below pre-implementation speeds.
In summer 2025, 51.5% of vehicles recorded were travelling at or below 24mph. This is a 2.3 percentage point (pp) reduction from the winter 2024/5 monitoring period. This is the lowest percentage of vehicles recorded travelling at or below 24mph since the implementation of the 20mph default speed limit. Before the change in speed limit, 22.6% of vehicles were recorded travelling at or below 24mph.
The 85th percentile speed, weighted by total vehicle volume, in summer 2025 was 30.0mph. This is 0.5mph faster than the recorded speeds in winter 2024/25 (29.5mph) and is 2.8mph lower than before the 20mph speed limit changes.
The weighted mean speed recorded in summer 2025 was 25.2mph. This is 3.3mph slower than before the 20mph speed limit change (28.5mph) and is 0.3mph faster than the weighted mean speed recorded in winter 2024/25 (24.9mph).
Table 2 shows how speeds have changed between periods and since the introduction of the default 20mph speed limit.
The summer 2025 data show that speeds, as defined using the three KPI measures, have increased slightly when compared to winter 2024/25. Speeds during summer 2025 were the fastest recorded since the implementation of the default 20mph speed limit. These changes are statistically significant.
However, all KPIs show speeds in summer 2025 are below the speeds recorded before the speed limit change. These reductions are statistically significant.
Table 2: KPI comparison with pre-implementation speeds
| Percentage travelling at or below 24mph | Change between periods | Weighted 85th percentile speed (mph) | Change between periods | Weighted mean speed (mph) | Change between periods | |
|---|---|---|---|---|---|---|
| Winter 2023/24 | +35.4pp | - | -3.7 | - | -4.1 | |
| Summer 2024 | +29.8pp | -5.6pp | -3.0 | +0.7 | -3.4 | +0.6 |
| Winter 2024/25 | +31.2pp | +1.5pp | -3.3 | -0.3 | -3.6 | -0.2 |
| Summer 2025 | +29.0pp | -2.3pp | -2.9 | +0.4 | -3.3 | +0.3 |
The vehicle speed distributions for each monitoring period are shown in Figure 1. In summer 2025, where 51.5% of vehicles were travelling at or below 24mph, 15.2% of vehicles were travelling at or below 19mph. This is a decrease from 15.7% in winter 2024/25.
Before the implementation of the speed limit changes, 36.1% of vehicles were recorded travelling at or above 30mph. In comparison, only 17.3% of vehicles were recorded travelling at or above 30mph in summer 2025.
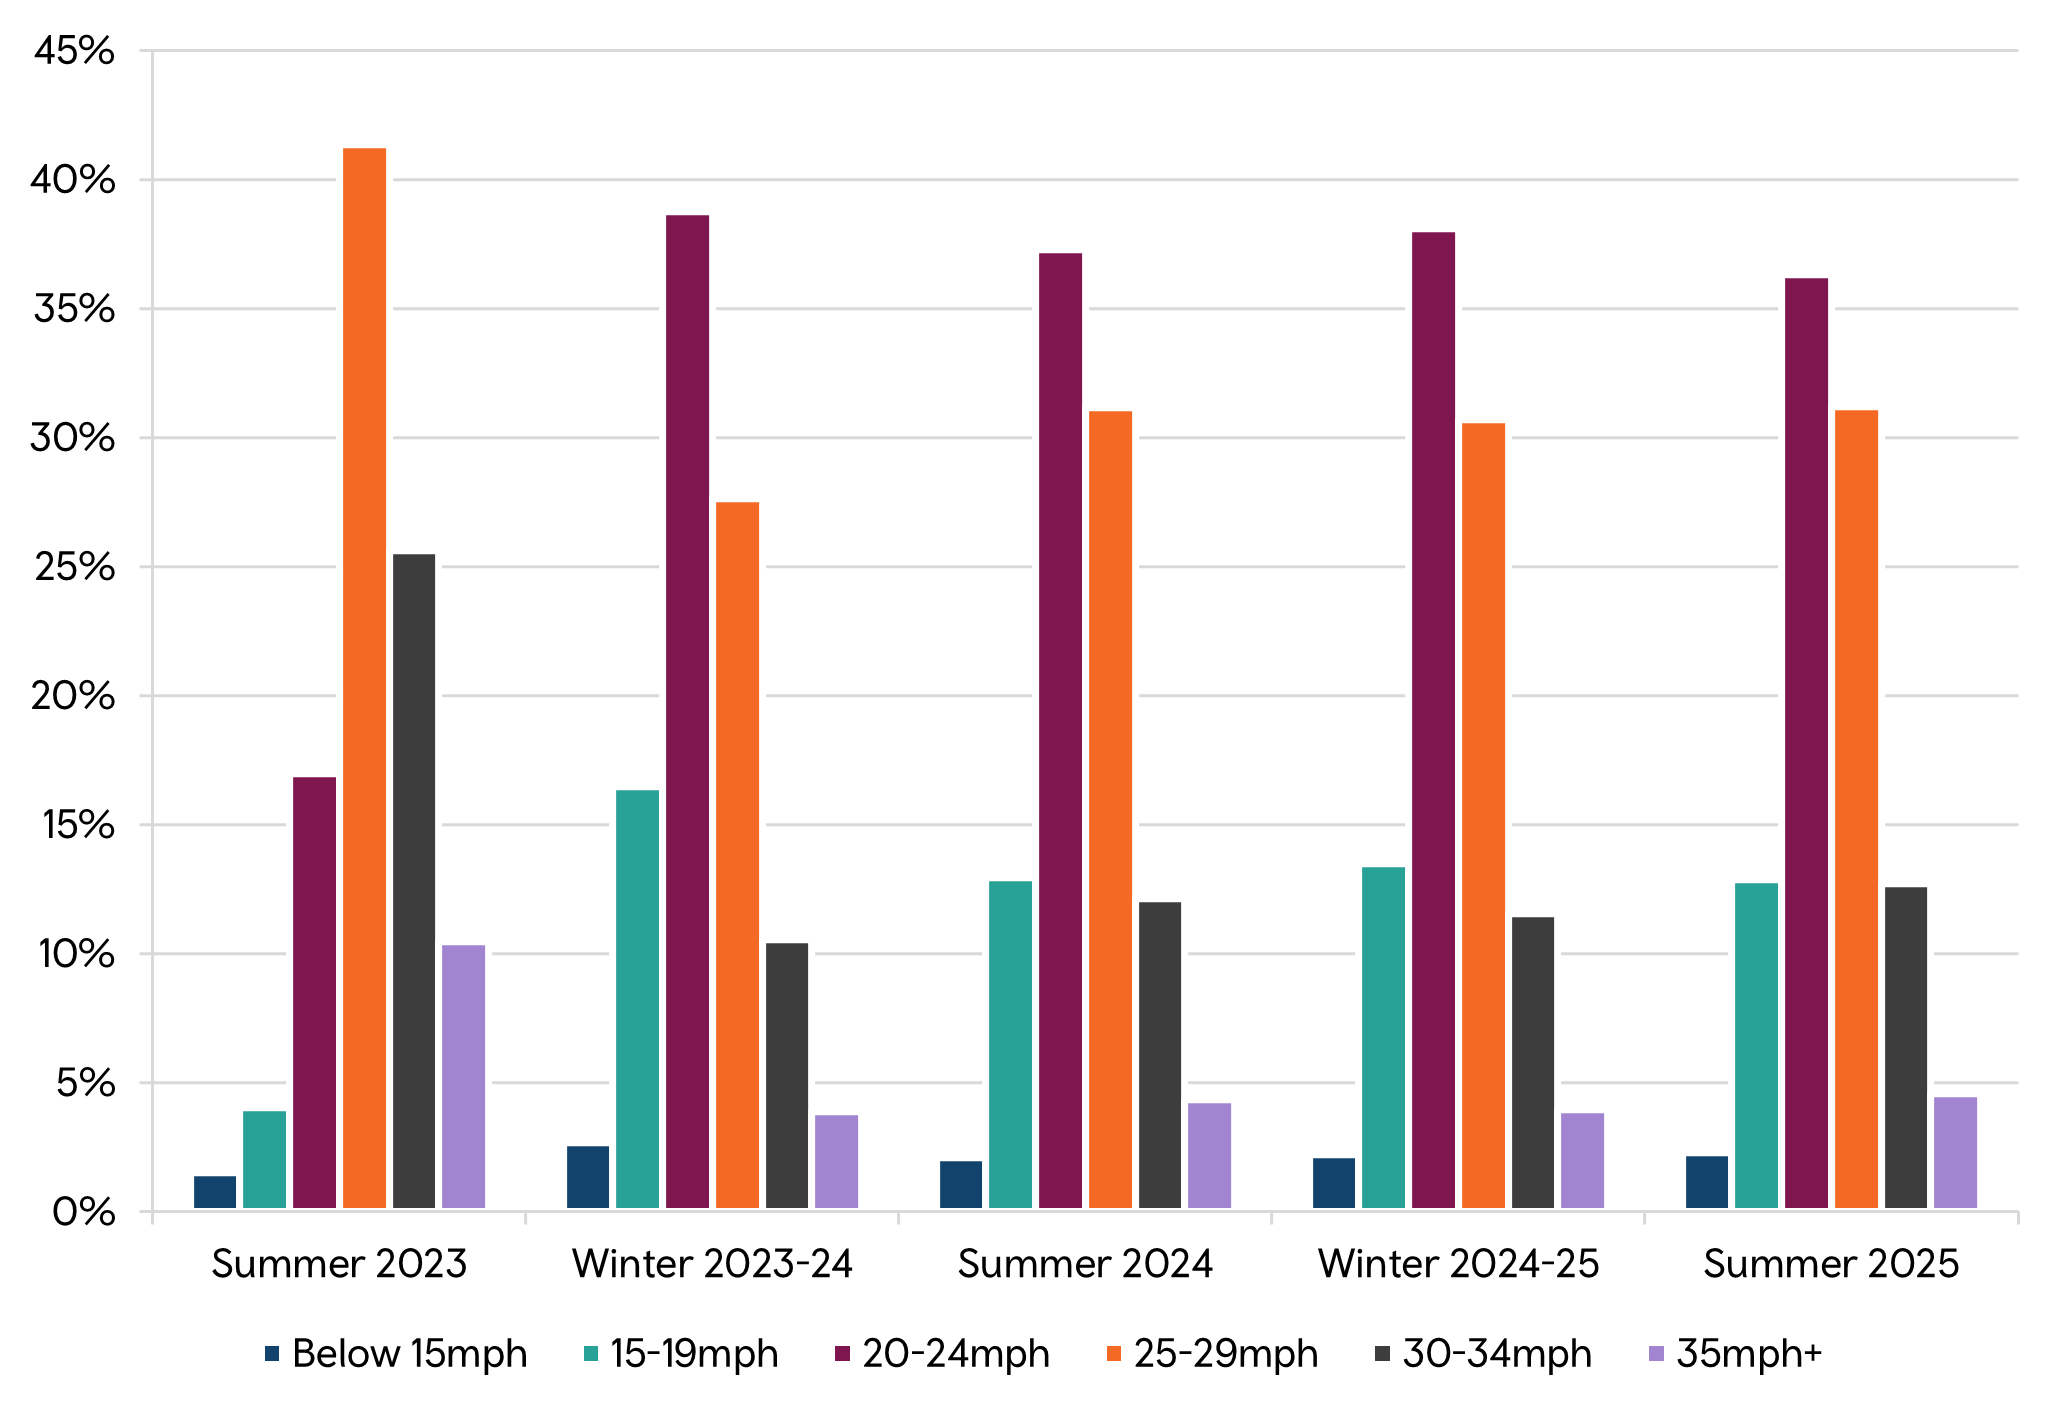
Figure 1: Speed distribution by monitoring period
Sites reverting to a 30mph speed limit
Between monitoring periods in summer 2025, the speed limit at five monitoring sites in the Wrexham area reverted to 30mph. Only two weeks of monitoring data (September 2025) is available with the new 30mph speed limit at these sites. This data is presented in Table 3.
Care should be taken when analysing the impact of reverting the speed limit to 30mph at these sites. The data are only representative of the sites monitored and should not be used to represent the expected change in driver behaviour when changing the speed limit from 20mph to 30mph.
Table 3: Speed monitoring at the five Wrexham sites where the speed limit has been changed back to 30mph in 2025
| Monitoring period | Percentage travelling at or below 24mph | Weighted 85th percentile speed (mph) | Weighted mean speed (mph) | Volume of vehicles recorded | Speed limit |
|---|---|---|---|---|---|
| Summer 2023 | 10.3% | 33.4 | 29.6 | 959,902 | 30mph |
| Winter 2023/24 | 63.2% | 28.7 | 24.0 | 1,020,204 | 20mph |
| Summer 2024 | 55.0% | 29.5 | 24.9 | 1,047,946 | 20mph |
| Winter 2024/25 | 55.2% | 29.3 | 24.9 | 1,028,752 | 20mph |
| July 2025¹ | 49.9% | 30.4 | 25.5 | 526,530 | 20mph |
| September 2025² | 22.7% | 31.8 | 27.9 | 533,767 | 30mph |
¹ Data recorded in July and September 2025 cover two-weeks of speed monitoring in each month. A total of 1,060,117 vehicles were recorded across the summer 2025 period.
² Data recorded in September 2025 were recorded after the speed limit reverted to 30mph.
Background information
This release summarises the vehicle speed data from monitoring sites across Wales. All roads monitored had a 30mph speed limit before 17 September 2023 and a 20mph speed limit from 17 September 2023 onwards. At the time of monitoring, all roads were largely free from physical restrictions or obstructions that reduce traffic speeds.
The analysis is based on a total of 20 weeks of speed monitoring in:
- Summer 2023 - four weeks of data pre-implementation covering two weeks in July and two weeks in September.
- Winter 2023/4 - four weeks of post-implementation data, covering two weeks in November and two weeks in January.
- Summer 2024 - four weeks of post-implementation data, covering two weeks in July and two weeks in September.
- Winter 2024/5 - four weeks of post-implementation data, covering two weeks in November and two weeks in January.
- Summer 2025 - four weeks of post-implementation data, covering two weeks in July and two weeks in September.
The summer 2023, summer 2024 and summer 2025 data compare like-for-like periods before and after the implementation of the default 20mph speed limit on restricted roads policy.
The winter 2023/24 and winter 2024/25 data allow us to compare like-for-like periods after the implementation of the default 20mph speed limit on restricted roads policy.
Local authorities have been reviewing feedback from people, business and communities as part of the National Listening Programme. In many areas, this programme has concluded, but some speed limit changes on individual roads are still expected. As outlined above, changes have already occurred in Wrexham. Monitoring sites from other areas may be affected as local authorities introduce changes. As such, future 20mph speed monitoring data may have to be revised.