Default 20mph speed limit on restricted roads Phase 1 areas
Default 20mph speed limit on restricted roads
Phase 1 areas
Final monitoring report
Average journey times Phase 1 monitoring
Default 20mph speed limit Phase 1 monitoring data
Compliance with the Code of Practise for Statistics:
1. Introduction
1.1. Background
This report presents the monitoring data obtained from the 20mph phase 1 areas up to the end of May 2023. It is the final report relating specifically to phase 1 and shows the effect of the reduced speed limit on traffic speeds, journey times by road, pedestrian and vehicle interactions, active travel (walking, wheeling and cycling) journeys to schools and air quality. Phase 1 results are summarised on page 31.
Future monitoring reports will cover the national default 20mph speed limit on ‘restricted roads’ which the Welsh Government introduced on 17 September 2023.¹
Following the recommendations of the Welsh 20mph Task Force Group Final Report (July 2020), the Welsh Government worked with local authorities to implement 20mph speed limits in eight areas during 2021-22, in advance of the national roll-out. These areas are referred to as phase 1 of the 20mph programme. The eight phase 1 areas are listed in table 1 in implementation date order.
Table 1: 20mph phase 1 areas
| Phase 1 area | Local authority | Implementation date |
| St Dogmaels | Pembrokeshire | 16 June 2021 |
| St Brides Major | Vale of Glamorgan | 09 July 2021 |
| Llanelli (North) | Carmarthenshire | 20 August 2021 |
| Buckley | Flintshire | 28 February 2022 |
| Cardiff (North) | Cardiff | 11 March 2022 |
| Cilfrew | Neath Port Talbot | 16 March 2022 |
| Abergavenny | Monmouthshire | 18 May 2022 |
| Severnside (Caerwent, Caldicot, Magor, Undy) |
Monmouthshire | 18 May 2022 |
1.2. Rationale for intervention
The rationale for reducing speed limits on restricted roads to 20mph is much wider than simply to reduce traffic speeds. Reduced traffic speeds are intended to benefit communities and the safety and well-being of people in Wales.
Introducing a lower speed limit is expected to reduce road collision likelihood and severity, with fewer pedestrians and cyclists being seriously or fatally injured. The lower speed limit is designed to support the Welsh Government’s vision for walking, wheeling and cycling to be the natural mode of choice for short everyday journeys.²
¹ Restricted roads are defined by the Road Traffic Regulation Act 1984 as those with streetlights at least every 200 yards. Unless signed otherwise, the default speed limit on restricted roads was 30mph before 17 September 2023 and is now 20mph.
² This vision is set out in the Active Travel Act Guidance (July 2021).
By reducing the number of injuries and fatalities on our roads and reducing the negative effects of car use on the wider environment, the change to 20mph is anticipated to have wide-reaching benefits.³ These include:
- More people choosing to walk, wheel or cycle (active travel) which will reduce the number of short distance car journeys in built-up areas.
- Increased social interaction within and across communities, leading to improved social cohesion.
- Improved physical and mental health outcomes due to increased physical activity and greater social interaction.
- Reduced NHS and taxpayer costs and reduced NHS workload as a result of fewer collisions (and reduced severity of injuries and trauma) on our roads.
- Reduced NHS costs resulting from the improved physical and mental health outcomes brought about by increased active travel.
- Strengthened local economies in areas previously affected by traffic speed issues, as a result of increased footfall and therefore increased retail and hospitality service activity.
- Contribution to the aims and objectives of the Well-Being of Future Generations (Wales) Act 2015, in particular to ‘enable places to support the health and well-being of people and communities’ within the ‘healthier Wales’ goal.
While these wide-reaching benefits are anticipated, they cannot easily be measured and attributed to a single policy intervention. There are many Welsh Government policy interventions directed towards achieving similar well-being benefits. To assess the impact of 20mph implementation, specific measurable objectives that will contribute towards the wider societal benefits have been established. These objectives are set out in the national 20mph monitoring framework and are summarised in section 2 of this report.
1.3. Phase 1 reporting
In our interim monitoring report, published March 2023, we set our intention to publish a second monitoring report for phase 1 (this report), encompassing a further six months of data. This report therefore includes data up to the end of May 2023.
A period of twelve months post-implementation is a relatively short timeframe for measuring the effects of an intervention that is intended to lead to benefits that will be realised over a long time period. The phase 1 areas are also geographically small. As an example, road traffic collision analysis would normally be carried out over three to five-year periods.⁴ The conclusions in this second report are therefore still based on limited data.
We used phase 1 to test data collection methods and analytical processes before finalising the national 20mph monitoring framework, published in September 2023.⁵
³ This list of benefits is based on ‘The Case for Change’ set out in the Welsh 20mph Task Force Group report, July 2020
⁴ RoSPA (2002) Road Safety Engineering Manual, RoSPA: London
⁵ Default 20mph speed limit on restricted roads: monitoring framework document, TfW, September 2023.
2. Objectives and key performance indicators
2.1. Monitoring framework overview
We published the national 20mph monitoring framework in September 2023.⁶ The framework provides a structured, evidence-based approach for monitoring the initial effects of implementing a default 20mph speed limit on restricted roads across Wales.
The national 20mph monitoring framework sets out three core objectives for implementing 20mph as the default speed limit on restricted roads:
- Reduce injury and death.
- Encourage a change in travel behaviour.
- Reduce negative effects of vehicle use on the wider environment.
The three core objectives are linked to five specific measurable objectives for 20mph speed limit implementation (see figure 1). These objectives are:
- Reduce the number of pedestrians and cyclists killed or seriously injured on the road network.
- Encourage mode shift from private car to walking and cycling for shorter journeys in built-up areas.
- Reduce motor vehicle dominance in vehicle and pedestrian interactions.
- Reduce carbon emissions from transport as a result of mode shift from private car to walking, wheeling and cycling for shorter journeys in built-up areas.
- Maintain or improve local air quality due to smoother traffic speeds with less acceleration and deceleration.
Key Performance Indicators (KPIs) are the main set of metrics that are being used to monitor progress against the objectives. Figure 2 presents the 12 KPIs that will be used for monitoring the national roll out.
2.2. Phase 1 monitoring
Based on data collected up to the end of May 2023, the following seven KPIs are assessed for the phase 1 areas in this report:
- Percentage traffic compliance with the 20mph speed limit (KPI 1.1)⁷
- Change in 85th percentile speed (KPI 1.2)
- Change in mean speed (KPI 1.3)
- Vehicle journey times and journey time variation on main through routes (KPI 1.4). This uses the difference between the 5th percentile and 95th percentile journey times as a proxy for journey time reliability.
⁶ Default 20mph speed limit on restricted roads: monitoring framework document, September 2023
⁷ The speed at which 85% of drivers drive at or below under free-flowing conditions.
- Change in attitude to active travel use in built-up areas (KPI 3.1)⁸
- Change in vehicle and pedestrian yielding behaviours (KPI 3.2)
- Change in local air quality based on nitrogen dioxide (NO₂) concentrations (KPI 4.1)
We are unable to report against the other five KPIs at this early stage in the 20mph programme. This is because of the limited geographical coverage of the phase 1 areas and the short timescales involved since implementation. The KPIs not assessed in this report are:
- Casualty rates for pedestrians and cyclists (KPIs 2.1, 2.2, 2.3). At least three years’ worth of collision data will be required post implementation to allow for meaningful comparisons with at least a three-year pre-implementation period.
- Change in carbon dioxide (CO₂) emissions (KPI 4.2). This will involve analyses undertaken over a longer time period and across larger geographical areas than covered by the phase 1 areas.
- Change in public attitudes to 20mph speed limits (KPI 5.1). This can only be assessed as more people experience the effects of 20mph after the national roll-out. This KPI will consider perceptions of traffic speeds, traffic noise and effects on communities and will be a qualitative assessment based on survey findings.
⁸ Active travel refers to journeys being made by walking, wheeling and cycling.
Figure 1: Objectives of default 20mph speed limit implementation
| Policy measure: Reduce default speed limit on restricted roads to 20mph | ||
| Improve the well being of people in Wales (health outcomes, social interaction, NHS costs, local economies) |
Reduce injury and death |
Reduce the number of pedestrians and cyclists killed or seriously injured on the road network |
| Encourage a change in travel behaviour |
Encourage mode shift from private car to walking and cycling for shorter journeys in built-up areas |
|
| Reduce motor vehicle dominance in vehicle and pedestrian interactions |
||
| Reduce negative effects of vehicle use on the wider environment |
Reduce carbon emissions from transport | |
| Maintain or improve local air quality | ||
Figure 2: KPIs for assessing the effects of the default 20mph speed limit implementation
| Objectives | Key performance indicators (KPIs) | |||
| 1.1: Traffic compliance with 20mph speed limit |
1.2: Change in 85th percentile speed |
1.3: Change in mean speed | ||
| 1.4: Vehicle journey times and journey time variation on main through routes (difference between 5th and 95th percentile journey times) |
||||
| Reduce the number of pedestrians and cyclists killed or seriously injured on the road network |
2.1: Casualty rate for child pedestrians (aged 5-11 years), by sex and deprivation fifth, also by sex and urban/rural |
2.3: Casualty rate for older pedestrians and cyclists (aged over 75 years), by sex and deprivation fifth, also by sex and urban/rural |
||
| 2.2: Casualty rate for pedestrians and cyclists aged 12-74, by sex and deprivation fifth, also by sex and urban/rural |
||||
|
Encourage mode shift from private car to walking Reduce motor vehicle dominance in vehicle and |
3.1: Change in attitude to active travel use in built-up areas |
3.2: Change in vehicle and pedestrian yielding behaviours |
||
|
Reduce carbon emissions from transport Maintain or improve local air quality |
4.1: Change in local air quality - NO₂ | 4.2: Change in CO₂ emissions | ||
| 5.1: Change in public attitudes to 20mph speed limits | ||||
3. Monitoring data
3.1. Traffic speeds
Locations and method
Traffic speed monitoring devices installed at 53 locations within the phase 1 areas are providing data for three KPIs:
- Percentage traffic compliance with the 20mph speed limit (KPI 1.1)
- Change in 85th percentile speed (KPI 1.2)⁹
- Change in mean speed (KPI 1.3)
Devices installed in four other areas, in close proximity to phase 1 areas, have been used as controls. In these areas, the speed limits remained predominantly 30mph until September 2023.
Table 2 provides a summary of speed monitoring device locations and data availability. The specific locations are shown on the maps in appendix A. Although devices are installed at all locations, continuous data is not available from every device or for the full period indicated in table 2. This is due to a combination of data errors, equipment failure, repair, downtime for battery replacement and device theft.
A range of speed devices are in use across the phase 1 and control locations, dependent on highway authority preference. These include induction loops cut into the carriageway, pneumatic tubes and column-mounted radar devices.
Table 2: Summary of speed monitoring device locations and data availability
| Phase 1 area | Number of 20mph speed monitoring locations |
Potential post-implementation data availability |
| Abergavenny | 7 | 12 months |
| Buckley | 5 | 1 year 1 month |
| Cardiff (North) | 12 | 1 year 1 month |
| Cilfrew | 5 | 1 year 2 months |
| Llanelli (North) | 7 | 1 year 9 months |
| Severnside (Caerwent, Caldicot, Magor, Undy) |
10 | 9 months |
| St Brides Major | 4 | 1 year 9 months |
| St Dogmaels | 3 | 1 year 4 months (limited due to equipment failure) |
⁹ The speed at which 85% of drivers drive at or below under free-flowing conditions.
Changes in the mean and 85th percentile speeds within each phase 1 area are weighted by traffic flows. This means that speeds on busier roads have a greater bearing on the calculated value than speeds on quieter roads.
Headline data - traffic speeds
Table 3 presents headline KPI assessments for traffic speeds based on data collected in phase 1 areas during the six months from December 2022 to the end of May 2023. The most recent six months of post-implementation data has been compared to up to six months of pre implementation data.
Table 3: Traffic speed KPI assessments
| KPI | KPI description | Final assessment (May 2023) |
| 1.1 | Percentage traffic compliance with the 20mph speed limit |
65% travelling at or below 24mph (50% pre-implementation) |
| 1.2 | Change in 85th percentile speed | 85th percentile speed reduced (-3.0mph) |
| 1.3 | Change in mean speed | Mean speed reduced (-1.6mph) |
Any speed reduction should be seen as a positive step towards achieving the wider well-being benefits of the default 20mph speed limit. It reduces both the likelihood of collisions occurring and injury severity.¹⁰
Data description - speed limit compliance
Traffic monitoring devices usually provide an output where vehicles are categorised automatically into 5mph speed bands. For example, 15-19mph inclusive, or 20 24mph. For KPI 1.1, anyone driving at or below 24mph is assumed to be broadly compliant with the new speed limit, as this matches one of the thresholds often used for enforcement.
Since the new 20mph speed limit was introduced, the percentage of vehicles recorded as travelling at or below 24mph within the phase 1 areas has increased from 50% to 65%. This is an increase of 15 percentage points when comparing the period between December 2022 and May 2023 to the pre-implementation period.
This increase is similar to the increase reported in our interim monitoring report, which showed that 68% of vehicles had been recorded as travelling at or below 24mph during the post-implementation period up to November 2022.
In Llanelli (North) there has been a continued increase in the percentage of vehicles travelling at or below 24mph.
Figure 3 shows variation by phase 1 area. Figure 4 shows similar data for Buckley.
¹⁰ An earlier study found that every 1mph reduction in urban mean speeds is shown to reduce the frequency of collisions by between 2% and 7%. Source: Taylor, M., Lynam, D., Baruya, A (2000) The effects of drivers’ speed on the frequency of road accidents, Crowthorne: TRL
Figure 3: Percentage of vehicles travelling at or below 24mph
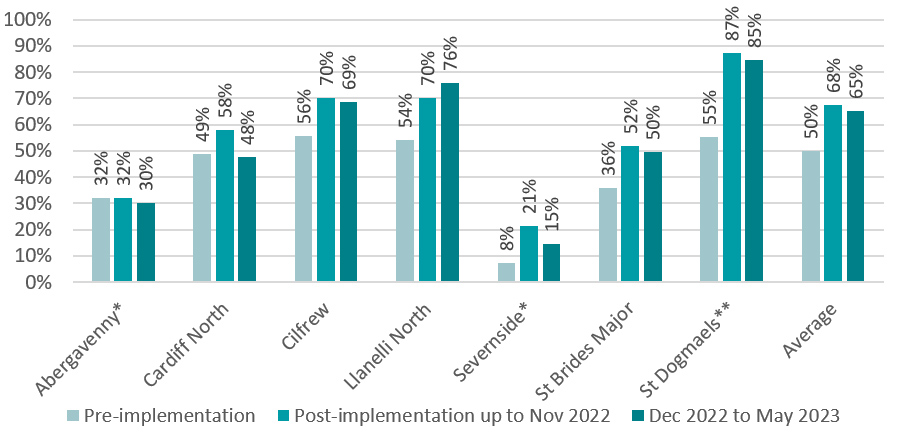
See figure 4 for speed data relating to Buckley.
* Pre and post-implementation (up to November 2022) percentages in Abergavenny and Severnside are based on single month datasets because of monitoring equipment performance issues.
Note: The 'Average’ column group in figure 3 excludes Abergavenny, Buckley and Severnside.
** No data available from St Dogmaels for Dec 2022 to May 2023 due to equipment failure, instead data from July 2023 has been used.
Some of the pre-implementation data in Buckley used an alternative automatic speed categorisation (below 20mph and below 30mph), as shown in figure 4. The percentage of vehicles travelling below 30mph in Buckley has remained consistent at 88% since the new 20mph speed limit was introduced. The percentage of vehicles travelling below 20mph has decreased slightly from 38% to 36%, although this remains much higher than the 2% recorded as travelling below 20mph pre-implementation.
Figure 4: Percentage of vehicles travelling below 20mph and 30mph in Buckley
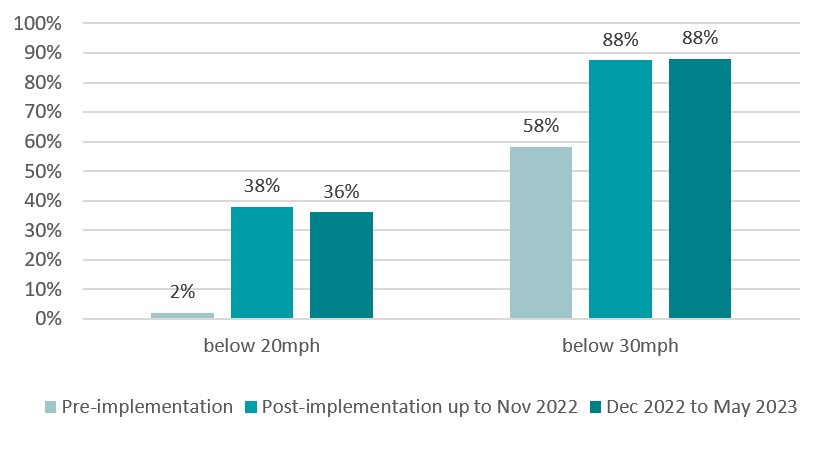
December 2022 to May 2023 compared to pre-implementation
The largest change in speeds when comparing the December 2022 to May 2023 data to the pre-implementation data was observed in St Dogmaels and Llanelli (North). In St Dogmaels there has been a change from 55% to 85% of vehicles travelling at or below 24mph following the 20mph speed limit introduction. This is an increase of 30 percentage points. In Llanelli, there has been a change from 54% to 76% of vehicles travelling at or below 24mph following the 20mph speed limit introduction. This is an increase of 22 percentage points.
Comparison with previously reported post-implementation data
When comparing the December 2022 to May 2023 period to the period up to the end of November 2022, all phase 1 areas have seen a reduction in the percentage of vehicles travelling at or below 24mph except for Llanelli (North). In Llanelli the number of vehicles travelling at or below 24mph has increased further from 70% to 76%, an increase of 6 percentage points.
Speed distributions
Following 20mph speed limit implementation, the percentage of vehicles travelling at speeds of 25mph and above reduced in the period up to the end of November 2022. This reduction was not quite as large during the December 2022 to May 2023 period. The speed distributions for the pre and post implementation periods are summarised in figure 5.
The percentage of vehicles in the speed categories above 30mph is unchanged between the pre-implementation and the December 2022 to May 2023 period, remaining at 16% of vehicles.
The largest change in speed distribution, from pre-implementation to the December 2022 to May 2023 period, occurred in the 25 to 29mph speed bracket with a decrease from 37% to 29%, a reduction of 8 percentage points. The second largest change was in the 15 to 19mph speed bracket which increased from 9% to 14% (5 percentage points).
Figure 5: Vehicle speed distribution across phase 1 areas
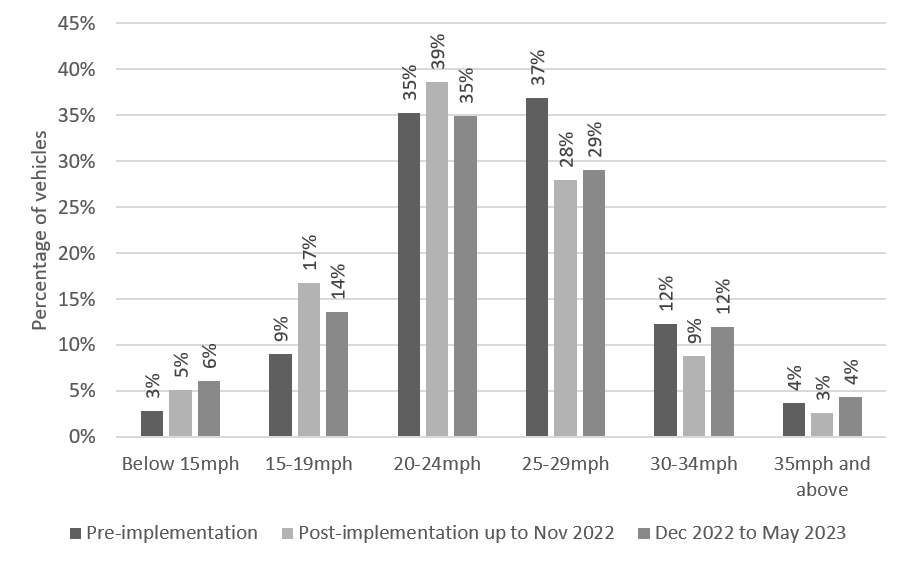
Note: For the period up to November 2022, figure 5 is based on the five phase 1 areas where several months of speed data are available and are less affected by equipment issues: Cardiff (North), Cilfrew, Llanelli (North), St Brides Major, St Dogmaels. For the period after December 2022, data from July 2023 has been used for St Dogmaels due to equipment failure during late 2022 and early 2023.
Data description - 85th percentile speeds
Based on data obtained up to May 2023 the 85th percentile speeds have changed as follows:¹¹
December 2022 to May 2023 compared to pre-implementation
- 85th percentile speeds have reduced by an average of 3.0mph.
- 85th percentile speeds have reduced in all phase 1 areas except for Abergavenny and Cardiff (see figure 6).
- The largest reductions in 85th percentile speeds were observed in St Dogmaels (-8.9mph), Buckley ( 5.8mph) and Llanelli North (-4.9mph).
December 2022 to May 2023 compared to the period up to November 2022
- 85th percentile speeds continued to reduce in Cilfrew, St Dogmaels and Llanelli but rebounded slightly in the other five phase 1 areas (see figure 6).
- The 85th percentile speed decreased by an average of 0.8 mph between these two periods.
- The largest rebound increase in 85th percentile speeds was observed in Cardiff North (+1.7mph) and Severnside (+1.6mph). The largest continued reduction in 85th percentile speed was observed in St Dogmaels (-4.0mph).
Figure 6: 85th percentile speeds in phase 1 areas, pre- and post-implementation
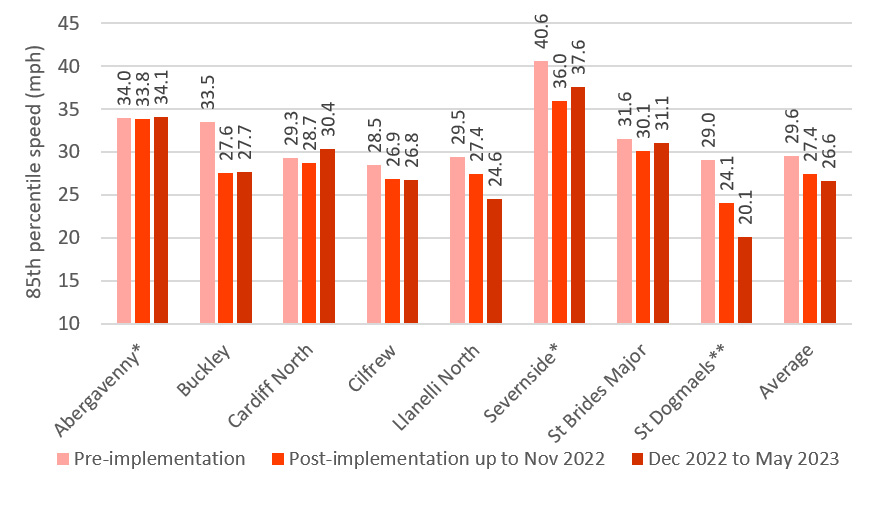
* Pre and post-implementation (up to November 2022) speeds in Abergavenny and Severnside are based on single month datasets because of monitoring equipment performance issues.
** No data available from St Dogmaels for Dec 2022 to May 2023 due to equipment failure. Instead data from July 2023 has been used.
Note: Figure 6 average excludes Abergavenny, Buckley and Severnside for consistency across KPIs.
¹¹ 85th percentile speeds are the speed at which 85% of drivers drive at or below under free-flowing conditions. In this report the 85th percentile speeds are based on hourly average data as individual raw vehicle speeds were not made available to TfW.
Data description - mean speeds
Mean speeds recorded during the December 2022 to May 2023 period remain below pre-implementation speeds by an average of 1.6mph.¹² Therefore, mean speeds have rebounded slightly, by an average of 1.0mph, compared to the period up to the end of November 2022 when mean speeds were reported as having reduced by an average of 2.6mph.
The level of speed reduction varies across the phase 1 areas (see figure 7). All phase 1 areas had mean speeds of at least 24.0mph before the new 20mph speed limit was introduced.
Figure 7: Mean speeds in phase 1 areas, pre- and post-implementation
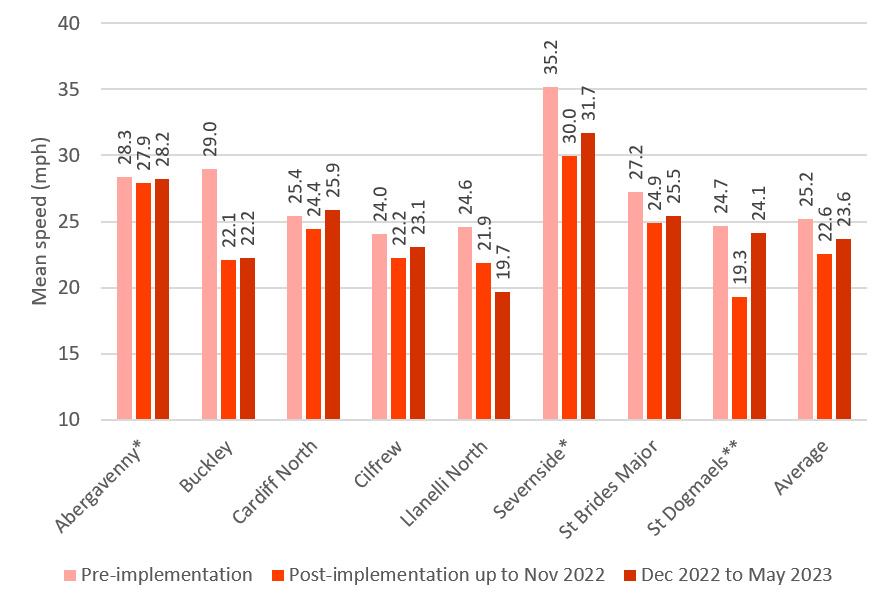
* Pre and post-implementation (up to November 2022) speeds in Abergavenny and Severnside are based on single month datasets because of monitoring equipment performance issues.
** No data available from St Dogmaels for Dec 2022 to May 2023 due to equipment failure. Instead data from July 2023 has been used.
Note: Figure 7 average excludes Abergavenny, Buckley, and Severnside for consistency across KPIs.
Comparing the December 2022 to May 2023 data to the pre-implementation data, all phase 1 areas have lower mean speeds except for Cardiff North. The greatest reduction in mean speeds has occurred in Buckley ( 6.8mph) and Llanelli North ( 4.9mph), with a post implementation mean speed of 19.7mph in Llanelli North, the lowest of all phase 1 areas.
¹² The results presented here are based on calculating a non-weighted mean of the phase 1 area weighted means for the pre- and post-implementation speed data, a method which avoids phase 1 areas with the greatest traffic flows dominating the overall statistics.
When comparing the December 2022 to May 2023 period against the period up to November 2022, most phase 1 areas experienced an increase in mean speeds. However, a continued reduction was seen in Llanelli North (-2.2mph).
Traffic speed trends
During the period up to the end of November 2022, mean speeds were continuing to decline in some of the phase 1 areas (such as Cardiff North and St Dogmaels). In other areas (such as Buckley and St Brides Major), speeds showed a larger initial drop but did not continue to reduce over time.
During the December 2022 to May 2023 period (shown in figure 8), mean speeds have remained consistent over the six months in Abergavenny, Buckley, Cilfrew and St Brides Major. The largest variations occurred in Severnside, Cardiff North and Llanelli North.¹³ The largest change during the period was in Llanelli North, reducing from a mean speed of 20.2mph in December 2022 to 17.6mph in May 2023.
Figure 8: Mean speed trends in phase 1 areas, December 2022 to May 2023
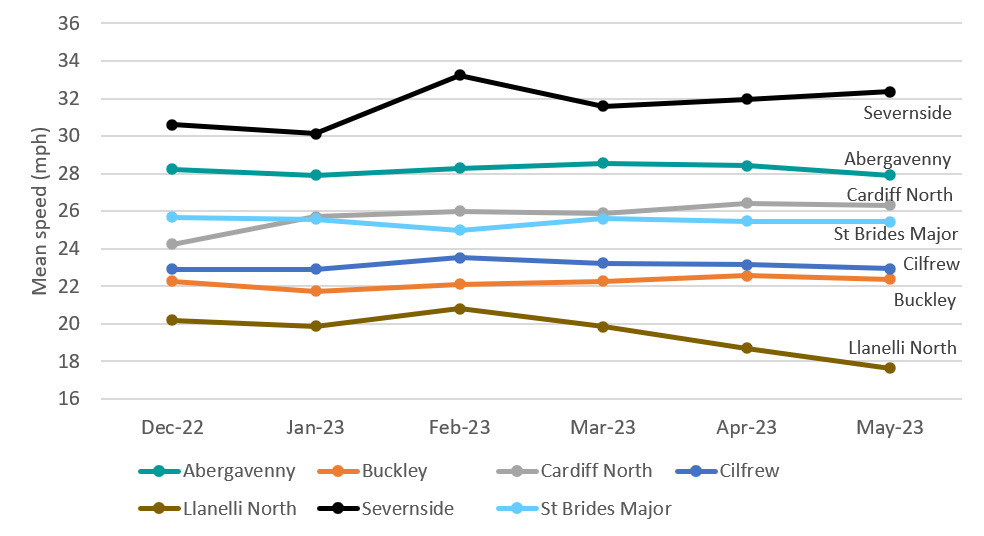
¹³ Data not available from St Dogmaels for the December 2022 to May 2023 period.
Control locations
Control locations allow us to observe vehicle speeds in places where speed limits remained at 30mph until 17 September 2023. Mean speeds have remained consistent across these control locations, with changes no greater than 0.4mph comparing the December 2022 to May 2023 period with the period up to November 2022.
In the previous interim monitoring report, we reported that mean speeds in control locations were higher than the post-implementation mean speeds recorded in the nearest 20mph phase 1 area.
For the December 2022 to May 2023 period, table 4 shows that mean speeds in control locations remain higher than the post-implementation mean speeds recorded in the nearest 20mph phase 1 area.
Table 4: Control location observed speeds comparison
| Control location (30mph speed limit) |
Mean speed (mph) | Mean speed in nearest phase 1 area (mph) |
||
| Up to Nov 2022 |
Dec 2022 to May 2023 |
Up to Nov 2022 |
Dec 2022 to May 2023 |
|
| Mold (near Buckley) | 25.6 | 25.5 | 22.1 | 22.2 |
| A466 Chepstow (near Severnside) |
34.3 | Data not available |
30.0 | 31.7 |
| Ogmore-by-Sea (near St Brides Major) |
34.0 | 34.4 | 24.9 | 25.5 |
| Bryncoch (near Cilfrew) |
25.7 | 25.5 | 22.2 | 23.1 |
3.2. Journey time reliability
Locations and method
Journey time reliability is a measure of how predictable variations in journey time are for the person travelling. Unpredictable journey times by road are usually caused by traffic congestion. This can mean that the same journey at the same time of day will take an unexpectedly different length of time to complete from one day to the next. While changing the speed limit to 20mph in built-up areas can lead to journey time increases for road traffic, it is not expected to impact journey time reliability. We would expect other factors such as delays at junctions to have a greater impact on overall journey time reliability.
We have established a KPI to check whether the new speed limit has led to any change in journey time reliability for all road traffic and separately for scheduled bus services. For all road traffic, this KPI is based on assessing the time difference between the slowest 5% of trips and the fastest 5% of trips along a route.¹⁴
Independent and anonymised vehicle telematics data, sourced through an existing Welsh Government contract with INRIX, has been used to determine the extent to which 20mph implementation may have resulted in a change to journey time reliability. Data has been obtained for main routes through the phase 1 areas.
Punctuality data for the full length of a sample of scheduled bus services passing through Abergavenny, Buckley, Cardiff (North) and Severnside has either been extracted from the CitySwift system or obtained directly from bus operators. CitySwift data is available through an existing Transport for Wales contract.
Bus service punctuality is defined as the percentage of on-time stop departures, where on-time is within 1 minute early and 5 minutes late. Bus service punctuality data is not readily available for the other four phase 1 areas, partly due to the limited number of bus services operating through these areas.
Journey times, journey time variations and bus punctuality data along routes through each phase 1 area have been obtained for the pre and post-implementation periods. Data from CitySwift is based on Tuesday to Thursday averages for the peak morning (0700-0900) and peak evening (1600 1800) periods. These are the busiest times of day for bus services.
¹⁴ Calculated from INRIX data as the difference between the 5th and 95th percentile journey times.
Headline data - journey time reliability
Table 5 presents the headline KPI assessment for vehicle journey time reliability based on data collected in phase 1 areas. Post-implementation data has been compared to a similar period of pre-implementation data.
Table 5: Journey time reliability KPI assessments
| KPI | KPI description | Final assessment (May 2023) |
|
1.4 |
Vehicle journey times and |
All traffic combined - minor changes in Scheduled bus services - general decrease |
Data description - all traffic combined
Mean journey times and journey time variations on routes through the phase 1 areas, based on vehicle telematics data obtained from INRIX, are summarised in tables 6, 7 and 8.
Data up to the end of November 2022
In the interim monitoring report we reported on journey time data up to the end of November 2022. The supporting data table is included again in this report (table 6).
March 2023
The changes in journey time for March 2023, when compared to pre-implementation journey times, are summarised in table 7. Key points from this more recent data are:
- Mean journey time increases on routes through the phase 1 areas are minimal and are generally not more than one minute. As with the previous data, the main exception is the 8.9km route along the B4245 through the Severnside area, where mean journey times are up to 2 minutes longer.
- Journey time variability has increased marginally, except in Abergavenny where journey time variability has reduced. Journey time variability along the A469 in Cardiff is mixed, with reduced variability in the morning period and increased variability in the evening period.
- As with the previous data, the largest increase in journey time variability has occurred on the B4245 through the Severnside area, with an increase of approximately 1 minute in the difference between the 5% slowest and 5% fastest journeys. This is almost identical to the findings from the previous data.
March 2023 compared to the period up to November 2022
The differences between the March 2023 data and the previously reported data up to November 2022 are summarised in table 8. The overall differences between the datasets are marginal, with some minor further increases in journey times and some minor reductions.
The majority of the differences reported in table 8 are within +/- 30 seconds. The exceptions to this are primarily linked to increased journey time variability southbound on the A469 and A4054 in Cardiff North. This increased journey time variability has occurred with minimal change to mean journey times, with some journeys quicker and some slower than in the dataset up to November 2022.
Table 6: Journey time changes, data collected up to November 2022 compared to pre-implementation
| Phase 1 area | Route | Time period |
Change in mean journey |
Difference between 5th and 95th |
||
| Direction 1 | Direction 2 | Direction 1 | Direction 2 | |||
| Abergavenny | A40 Nevill Hall to Hardwick Roundabout (4.3km) Direction 1: Eastbound / Direction 2: Westbound |
AM | 00:03 | 00:06 | -00:27 | -00:24 |
| PM | -00:40 | -00:01 | -02:41 | -01:03 | ||
| Buckley | B5128 Liverpool Road and Mill Lane (1.7km) Direction 1: Southbound / Direction 2: Northbound |
AM | 00:15 | 00:24 | 00:05 | 00:17 |
| PM | 00:27 | 00:09 | 00:25 | 00:02 | ||
| Cardiff (North) | A469 Thornhill to Gabalfa (3.5km) Direction 1: Southbound / Direction 2: Northbound |
AM | 00:09 | 00:31 | -03:51 | -00:17 |
| PM | 00:24 | 02:09 | -00:29 | 02:07 | ||
| Cardiff (North) | A4054 Coryton to Llandaf (4.0km) Direction 1: Southbound / Direction 2: Northbound |
AM | 01:46 | 00:41 | 01:12 | -00:24 |
| PM | 00:37 | 00:33 | -01:00 | -00:01 | ||
| Llanelli (North) | Dafen Road (1.8km) Direction 1: Westbound / Direction 2: Eastbound |
AM | 00:08 | 00:11 | 00:30 | 00:35 |
| PM | 00:08 | 00:00 | 00:05 | 00:43 | ||
| Llanelli (North) | Capel Isaf Road and Frondeg Terrace (1.1km) Direction 1: Westbound / Direction 2: Eastbound |
AM | 00:07 | 00:18 | 00:18 | 00:17 |
| PM | 00:12 | 00:22 | 00:20 | 00:27 | ||
| Severnside (Caerwent, Caldicot, Magor, Undy) |
B4245 Magor to Portskewett (8.9km) Direction 1: Eastbound / Direction 2: Westbound |
AM | 01:32 | 01:30 | 01:11 | 01:06 |
| PM | 01:29 | 01:37 | 01:03 | 01:25 | ||
| St Brides | B4265 through village (2.6km) Direction 1: Southbound / Direction 2: Northbound |
AM | 00:32 | 00:24 | 00:13 | 00:10 |
| PM | 00:36 | 00:21 | 00:22 | 00:04 | ||
Source: Based on data obtained from INRIX * Note: Minus (negative) signs indicate reduced journey times or reduced variation post-implementation
Table 7: Journey time changes, data collected March 2023 compared to pre-implementation
| Phase 1 area | Route | Time period |
Change in mean journey |
Difference between 5th and 95th |
||
| Direction 1 | Direction 2 | Direction 1 | Direction 2 | |||
| Abergavenny | A40 Nevill Hall to Hardwick Roundabout (4.3km) Direction 1: Eastbound / Direction 2: Westbound |
AM | 00:07 | 00:07 | -00:25 | -00:31 |
| PM | -00:54 | -00:04 | -02:16 | -00:40 | ||
| Buckley | B5128 Liverpool Road and Mill Lane (1.7km) Direction 1: Southbound / Direction 2: Northbound |
AM | 00:15 | 00:22 | -00:01 | 00:12 |
| PM | 00:18 | 00:15 | 00:09 | 00:19 | ||
| Cardiff (North) | A469 Thornhill to Gabalfa (3.5km) Direction 1: Southbound / Direction 2: Northbound |
AM | 00:32 | 00:28 | -01:19 | -00:22 |
| PM | 00:23 | 00:13 | 00:25 | 01:34 | ||
| Cardiff (North) | A4054 Coryton to Llandaf (4.0km) Direction 1: Southbound / Direction 2: Northbound |
AM | 01:38 | 00:17 | 01:23 | -00:52 |
| PM | 00:23 | -00:08 | 02:16 | -01:48 | ||
| Llanelli (North) | Dafen Road (1.8km) Direction 1: Westbound / Direction 2: Eastbound |
AM | 00:05 | 00:03 | 01:22 | 00:27 |
| PM | 00:17 | -00:02 | 00:03 | 00:15 | ||
| Llanelli (North) | Capel Isaf Road and Frondeg Terrace (1.1km) Direction 1: Westbound / Direction 2: Eastbound |
AM | 00:03 | 00:19 | 00:29 | 00:44 |
| PM | 00:11 | 00:24 | 00:24 | 00:42 | ||
| Severnside (Caerwent, Caldicot, Magor, Undy) |
B4245 Magor to Portskewett (8.9km) Direction 1: Eastbound / Direction 2: Westbound |
AM | 01:50 | 01:58 | 01:05 | 01:06 |
| PM | 01:50 | 01:47 | 01:17 | 01:15 | ||
| St Brides | B4265 through village (2.6km) Direction 1: Southbound / Direction 2: Northbound |
AM | 00:36 | 00:28 | 00:14 | 00:16 |
| PM | 00:35 | 00:24 | 00:13 | 00:05 | ||
Source: Based on data obtained from INRIX * Note: Minus (negative) signs indicate reduced journey times or reduced variation post-implementation.
Table 8: Post-implementation journey time changes between data to November 2022 and March 2023 data
| Phase 1 area | Route | Time period |
Change in mean journey |
Change in variability - difference |
||
| Direction 1 | Direction 2 | Direction 1 | Direction 2 | |||
| Abergavenny | A40 Nevill Hall to Hardwick Roundabout (4.3km) Direction 1: Eastbound / Direction 2: Westbound |
AM | 00:04 | 00:01 | 00:02 | -00:11 |
| PM | -00:14 | -00:03 | -00:02 | 00:23 | ||
| Buckley | B5128 Liverpool Road and Mill Lane (1.7km) Direction 1: Southbound / Direction 2: Northbound |
AM | 00:00 | -00:02 | -00:06 | -00:05 |
| PM | -00:09 | 00:06 | -00:16 | 00:17 | ||
| Cardiff (North) | A469 Thornhill to Gabalfa (3.5km) Direction 1: Southbound / Direction 2: Northbound |
AM | 00:23 | -00:03 | 02:32 | -00:05 |
| PM | -00:01 | -01:56 | 00:54 | -00:33 | ||
| Cardiff (North) | A4054 Coryton to Llandaf (4.0km) Direction 1: Southbound / Direction 2: Northbound |
AM | -00:08 | -00:24 | 00:11 | -00:28 |
| PM | -00:14 | -00:41 | 03:16 | -01:47 | ||
| Llanelli (North) | Dafen Road (1.8km) Direction 1: Westbound / Direction 2: Eastbound |
AM | -00:03 | -00:08 | 00:52 | -00:08 |
| PM | 00:09 | -00:02 | -00:02 | -00:28 | ||
| Llanelli (North) | Capel Isaf Road and Frondeg Terrace (1.1km) Direction 1: Westbound / Direction 2: Eastbound |
AM | -00:04 | 00:01 | 00:11 | 00:27 |
| PM | -00:01 | 00:02 | 00:04 | 00:15 | ||
| Severnside (Caerwent, Caldicot, Magor, Undy) |
B4245 Magor to Portskewett (8.9km) Direction 1: Eastbound / Direction 2: Westbound |
AM | 00:18 | 00:28 | -00:06 | 00:00 |
| PM | 00:21 | 00:10 | 00:14 | -00:10 | ||
| St Brides | B4265 through village (2.6km) Direction 1: Southbound / Direction 2: Northbound |
AM | 00:04 | 00:04 | 00:01 | 00:06 |
| PM | -00:01 | 00:03 | -00:09 | 00:01 | ||
Source: Based INRIX data *Note: Minus (negative) signs indicate reduced/improved journey times or reduced/improved variation between reporting periods.
Data description - scheduled bus services
In the interim monitoring report, we used vehicle GPS tracking data from the CitySwift system to show that the change in bus service punctuality during peak periods was mixed. Bus routes passing through some phase 1 areas saw improvements while others saw a worsening in punctuality. Bus service punctuality varied by time period and area. The changes were inconsistent even within the same area.
For the six-month period up to May 2023, only the data for Buckley remained available in the CitySwift system (see table 9). Alternative data was obtained directly from bus operators for other areas (see table 10).
Bus services through Buckley, Cardiff (North) and Severnside experienced a decline in punctuality, while services through Abergavenny experienced an improvement compared with October 2021 (pre-implementation).
The bus operator providing the data for the Severnside area has advised that bus punctuality reductions have occurred despite changes to the bus route which involved shortening the route slightly in September 2022. These service changes were made by the operator in response to the new 20mph speed limit.
Table 9: Bus punctuality on routes passing through Buckley
| Phase 1 area | Percentage point change in on-time* bus stop-departures for the full length of sampled services passing through |
|||
| AM (0700-0900) | PM (1600-1800) | |||
| Up to Nov 2022 |
Dec 2022 to May 2023 |
Up to Nov 2022 |
Dec 2022 to May 2023 |
|
| Buckley | -12.2 | -12.5 | -7.4 | -12.9 |
Source: Based on data obtained from the CitySwift system.
* On-time: Percentage of on-time stop departures, where on-time is within 1 minute early and 5 minutes late. Minus (negative) signs indicate where bus punctuality has worsened
Table 10: Bus punctuality on routes through Abergavenny, Cardiff and Severnside
| Phase 1 area | Percentage point change in on-time* bus stop-departures for the full length of sampled services passing through, comparing March 2023 to October 2021 (Abergavenny and Cardiff) and June 2023 to March 2021 (Severnside) |
| Abergavenny | +12 |
| Cardiff North (A469 Thornhill Road) |
-6 |
| Severnside | -7 |
Source: Data obtained directly from individual bus operators for Abergavenny (one operator), Cardiff (one out of three operators serving the A469 corridor), Severnside (one operator).
* On-time: Percentage of on-time stop departures, where on-time is within 1 minute early and 5 minutes late. Minus (negative) signs indicate where bus punctuality has worsened.
3.3. Vehicle and pedestrian interactions
Locations and method
Vehicle and pedestrian interaction assessments consider how drivers react in response to pedestrians intending to cross or already crossing the road. Transport for Wales commissioned VivaCity to install camera equipment to monitor vehicle and pedestrian interactions. VivaCity has combined this equipment with specialist software to analyse interactions.
VivaCity installed camera equipment at a pedestrian crossing point in three phase 1 areas (Abergavenny, Buckley and Cardiff North) and at a pedestrian crossing point in three control locations outside the phase 1 areas (Gilwern, Queensferry and north-east Cardiff).
Data from each pedestrian crossing point has been processed for three reporting periods following 20mph speed limit implementation: 6-19 June 2022, 12-15 September 2022 and 1-31 March 2023. Data obtained from phase 1 areas has been compared to data obtained from control locations.
Observed vehicle and pedestrian interactions are assigned to one of five separate categories:
- Vehicle slowed or stopped, to allow a pedestrian to cross.
- Vehicle maintained speed, despite pedestrian detected in the waiting area.
- Vehicle maintained speed, despite pedestrian detected in the crossing area.
- Vehicle sped up, despite pedestrian detected in the waiting area.
- Vehicle sped up, despite pedestrian detected in the crossing area.
The two categories for ‘vehicle sped up’ represent the most potentially dangerous behaviour.
Headline data - vehicle and pedestrian interactions
Table 11 presents the headline KPI assessment for vehicle and pedestrian interactions based on post-implementation data collected in three phase 1 areas and three control locations.
Table 11: Vehicle and pedestrian interaction KPI assessment
| KPI | KPI description | Final assessment (March 2023) |
| 3.2 | Change in vehicle and pedestrian yielding behaviours |
Tentative conclusion: fewer vehicles speeding up when approaching pedestrians in phase 1 areas |
Data description - vehicle and pedestrian interactions
The following key points have been identified from the analysis undertaken by VivaCity up to May 2023:
- ‘Maintained speed’ was the most common category for vehicle and pedestrian interactions at all camera locations, regardless of speed limit.
- The proportion of vehicles that ‘maintained speed’ when approaching pedestrians reduced during the March 2023 survey period, alongside an increase in the proportion of vehicles slowing down and an increase in the proportion speeding up on roads with 20mph and 30mph speed limits.
- Interactions involving vehicles speeding up when approaching pedestrians were less common at pedestrian crossing points where a 20mph speed limit is present. It is unclear to what extent the speed limit change has contributed to this reduction.
In both monitoring periods ‘maintained speed’ does not necessarily mean that any dangerous behaviour has occurred, as both the vehicle speed and exact pedestrian location would need to be considered.
Table 12 shows the percentages of vehicles that slowed or maintained speed and those that sped up in the presence of pedestrians. Roads with 30mph speed limits had higher percentages of potentially dangerous speeding up behaviours.
Table 12: Vehicle and pedestrian interaction results
| Driver Behaviour |
June and September 2022 |
March 2023 | Average | |||
| 20mph | 30mph | 20mph | 30mph | 20mph | 30mph | |
| Slowed or maintained speed |
96% | 94% | 88% | 81% | 93% | 88% |
| Sped up | 4% | 6% | 12% | 19% | 7% | 12% |
VivaCity has noted that driver behaviour is dependent on the road layout as well as the speed limit. Further data from the six camera locations will be needed over the next year before any firm conclusions can be drawn. The three control locations have now become subject to the new default 20mph speed limit. This will allow before and after data for those locations to be reported in future.
3.4. Active travel
Locations and method
The Welsh Government commissioned Living Streets to work with primary schools within the phase 1 areas and in control locations during the 2021-22 academic year to better understand travel behaviours and attitudes towards active travel (walking, wheeling and cycling). Control locations involved primary schools that are not currently fully surrounded by 20mph speed limits. Through this commission, Living Streets were able to monitor the early effects of the new 20mph speed limits on journeys to school.
This commission has not been repeated for the 2022-23 academic year. Results from the 2021-22 academic year are therefore restated in this report. Further detail on the method and schools involved is available in our interim monitoring report.
Headline data
Table 13 presents the headline KPI assessment for attitude to active travel use. It compares journey to school data collected in phase 1 areas with data collected in control locations that are not part of phase 1. As the Living Streets method involved incentives for participants and because the weather improved towards the end of the academic year, active travel use increased at all participating schools.
Table 13: Attitude to active travel use KPI assessment
| KPI | KPI description | Interim assessment (Nov 2022) |
|
3.1 |
Change in attitude to active travel |
51% increase in active travel use on |
Data description
Living Streets used survey data from the first part of the 2021/22 academic year to provide a baseline estimate for the percentage of journeys to school made by active travel. Survey data showed that, on average, 49% of children in the phase 1 area schools and 49% of children in the control location schools either walked or cycled to school. Table 14 shows that there was variation between schools. The variation is due to their differing locations and nature of their catchment areas.
Over the remainder of the academic year, the proportion of journeys made by active travel increased at all schools. However, the increase was greatest at schools within the phase 1 areas, with active travel journeys to school increasing from 49% to 74%. This is a 51% increase in journeys or a 25 percentage point increase in the mode share for active travel.
At schools in control locations, active travel journeys to school increased from 49% of journeys to 67%. This is a 37% increase in journeys or an 18 percentage point increase in the mode share for active travel.
Survey data shows that most of the switch to active travel occurred from children who were previously driven by car for the full journey to school.
The key data challenges and limitations were:
- The 20mph speed limit was already in place in three of the phase 1 areas (St Dogmaels, St Brides Major and Llanelli) before surveys began, which may have increased the baseline percentage slightly.
- Active travel numbers included ‘park and stride’, where children walk part of the journey to school.
Table 14: Change in active travel use at primary schools
| Primary school location |
Active travel baseline |
Active travel % over 2021-22 academic year |
Main survey launch |
| St Dogmaels | 58% | 85% | March 2022 |
| St Brides Major | 44% | 93% | February 2022 |
| Llanelli North | 54% | 61% | February 2022 |
| Buckley | 48% | 77% | May 2022 |
| Cardiff North | 56% | 74% | January 2022 |
| Abergavenny | 33% | 62% | February 2022 |
| Severnside | 48% | 69% | January 2022 |
| Average | 49% | 74% | |
| Control average |
49% | 67% |
Source: Based on data provided to the Welsh Government by Living Streets
Many parents and carers who participated in the Living Streets qualitative surveys considered the 20mph speed limits to be beneficial in making active travel more attractive. However, a lower speed limit is just one of many things that make people consider whether active travel is a viable option for journeys to school. Distance to school, the weather, quality of infrastructure, personal safety and additional journeys linked to the school run are some of the other factors.
3.5. Air quality
Locations and method
Transport for Wales commissioned a specialist team from Jacobs to monitor air quality in three of the phase 1 areas. Air quality sensors were installed in May 2022 at locations alongside the A469 in Cardiff and the B4245 in Magor (Severnside area). In 2023, sensors were installed adjacent to the A40 in Abergavenny. Specific locations are shown in appendix A. The sensors are capable of monitoring differences in pollutant concentrations of nitrogen dioxide (NO₂), and some particulate matters. The focus for this report is on NO₂ as concentrations of particulate matters are more heavily influenced by emissions from regional sources other than road traffic.
Pairs of air quality sensors have been installed on the same stretch of road, one within and one outside the introduced 20mph speed limit. The purpose of installing pairs of sensors is to identify whether there is any material difference between NO₂ levels at a site where the speed limit has been reduced to 20mph and a nearby site where the speed limit has remained at 30mph.
Before installation, the sensors were calibrated against a reference station forming part of the Air Quality Wales Network, which improved the precision and accuracy of the sensors relative to the reference station and relative to the other sensor within each pair.
Data from November 2022 to May 2023 has been downloaded and analysed. Data from Cardiff, Magor and Abergavenny confirmed that measured NO₂ concentrations are strongly influenced by traffic conditions on the adjacent road. For example, NO₂ concentrations increase when traffic volumes increase and similarly decline when traffic volumes are lower.
During the survey period, particularly elevated NO₂ concentrations were recorded by one of the sensors along the A469 in Cardiff during construction of a new raised pedestrian crossing and supporting footpath improvements. This is potentially due to construction vehicles and increased traffic congestion close to the sensor. The data obtained during the roadworks period has been removed for the purpose of monitoring the effects of the 20mph speed limit.
Similarly, elevated NO₂ concentrations were identified at the sensor outside the zone in Magor (Severnside) between 20 December 2022 and 09 January 2023. During this period, weather-related Severn bridge closures resulted in an increase in traffic flow and congestion at the junctions to the west of the sensor. Data during this period has been removed.
Headline data
Table 15 presents the headline KPI assessment for air quality based on post-implementation data collected in Abergavenny, Cardiff (North) and Magor (Severnside area).
Table 15: Air quality KPI assessment
| KPI | KPI description | Final assessment (May 2023) |
|
4.1 |
Change in local air quality - |
No material effect identified to date |
Data description
Table 16 summarises the air quality data collected between December 2022 and May 2023. The observed differences in Cardiff and Magor suggest that NO₂ concentrations within the 20mph area are slightly lower compared to outside. However, the changes are within or very close to the average level of measurement uncertainty between sensors (approximately 2-6 µg/m³). Therefore, these differences may represent slight variations in performance between the sensors. There is no clear difference in measured NO₂ concentrations which can confidently be attributed to the new 20mph speed limit.
For Abergavenny, NO₂ concentrations within the 20mph area are slightly higher compared to outside. These differences are again within the average level of measurement uncertainty between the sensors (approximately 2-6 µg/m³). Traffic flows on the stretch of road where the 20mph sensor is located (to the east of the Nevill Hall hospital entrance) are higher than the traffic flows on the stretch of road by the 30mph sensor (west of the hospital entrance). As more data are obtained at this location, further analysis will be undertaken.
Table 16: Mean NO₂ concentrations recorded between Dec 2022 and May 2023
| Phase 1 area |
NO₂ concentration on 20mph road (µg/m³) |
NO₂ concentration on adjacent 30mph road (µg/m³) |
Recorded difference within 20mph area (µg/m³) |
| Abergavenny | 16.1 | 13.0 | +3.1 |
| Cardiff North | 37.4 | 40.1 | -2.7 |
| Magor (Severnside) |
16.9 | 20.0 | -3.2 |
4. Summary
An assessment summary for all KPIs based on data collected in the phase 1 areas up to May 2023 is provided in table 17.
Table 17: Final KPI assessment summary for phase 1 areas
| KPI | KPI description | Final assessment | Change* |
|
1.1 |
Percentage traffic |
65% travelling at or below 24mph |
++ |
|
1.2 |
Change in 85th percentile |
85th percentile speed reduced |
++ |
|
1.3 |
Change in mean speed |
Mean speed reduced (-1.6mph) |
+ |
|
1.4 |
Vehicle journey times and |
All traffic combined - minor changes in Scheduled bus services - general |
- |
|
3.1 |
Change in attitude to active |
Based on data collected during |
++ |
|
3.2 |
Change in vehicle and |
Tentative conclusion: fewer vehicles |
+ |
|
4.1 |
Change in local air quality - |
No material effect identified to date |
0 |
* Change compared to the situation pre-implementation: ++ (large positive), + (slight positive), 0 (no discernible change), - (slight negative), - - (large negative).