Vehicle speed monitoring data: July 2023 to January 2025
Summary
Vehicle speed monitoring data January 2025
These statistics provide insights into vehicle speeds recorded at monitoring sites on main through roads across Wales. Monitoring has taken place where a 20mph speed limit now applies. The data summarise vehicle speeds against the three Key Performance Indicators (KPIs) outlined in the national 20mph monitoring framework. The data were collected from 43 monitoring sites on main roads across 10 areas, covering around 7 million vehicles in each monitoring period. The data should not be taken as representative of average speeds on all roads with a 20mph speed limit.
Table 1: KPI assessment
| Key Performance Indicator | Summer 2023 | Winter 2023/24 | Summer 2024 | Winter 2024/25 |
|---|---|---|---|---|
| Percentage travelling at or below 24mph | 20.8% | 58.7% | 52.7% | 54.0% |
| Weighted 85th percentile speed (mph) | 32.9 | 29.1 | 29.8 | 29.5 |
| Weighted mean speed (mph) | 28.7 | 24.4 | 25.1 | 24.9 |
In winter 2024/25, 54.0% of vehicles recorded were travelling at or below 24mph. This is a 1.3 percentage point (pp) increase from the summer 2024 monitoring period. Before the change in speed limit, 20.8% of vehicles were travelling at or below 24mph.
The 85th percentile speed, weighted by total vehicle volume, in winter 2024/25 was 29.5mph. This is 0.3mph slower than the recorded speeds in summer 2024 (29.8mph), and is 3.4mph lower than before the 20mph speed limit changes.
The weighted mean speed recorded in winter 2024/25 was 24.9mph. This is 3.8mph slower than before the 20mph speed limit change (28.7mph), and is 0.2mph slower than the weighted mean speed recorded in Summer 2024 (25.1mph).
Table 2 shows how speeds have changed between periods and since the introduction of the default 20mph speed limit.
The winter 2024/25 data show that speeds, as defined using the three KPI measures, have reduced slightly when compared to summer 2024. However, the speeds are faster than those recorded the previous year in winter 2023/24. These changes are statistically significant.
All KPIs show speeds in winter 2024/25 are below the speeds recorded before the speed limit change. These reductions are statistically significant.
Table 2: KPI comparison with pre-implementation speeds
| Percentage travelling at or below 24mph | Change between periods | Weighted 85th percentile speed (mph) | Change between periods | Weighted mean speed (mph) | Change between periods | |
| Winter 2023/24 | +37.9pp | - | -3.8 | - | -4.3 | |
| Summer 2024 | +31.9pp | -6.0pp | -3.1 | +0.7 | -3.6 | +0.7 |
| Winter 2024/25 | +33.2pp | +1.3pp | -3.4 | -0.3 | -3.8 | -0.2 |
The vehicle speed distributions for each monitoring period are shown in Figure 1. In winter 2024/25, where 54.0% of vehicles were travelling at or below 24mph, 15.4% of vehicles were travelling at or below 19mph. This is an increase from 14.9% in summer 2024.
Before the implementation of the speed limit changes, 37.0% of vehicles were recorded travelling at or above 30mph. In comparison, only 15.2% of vehicles were recorded travelling at or above 30mph in winter 2024/25.
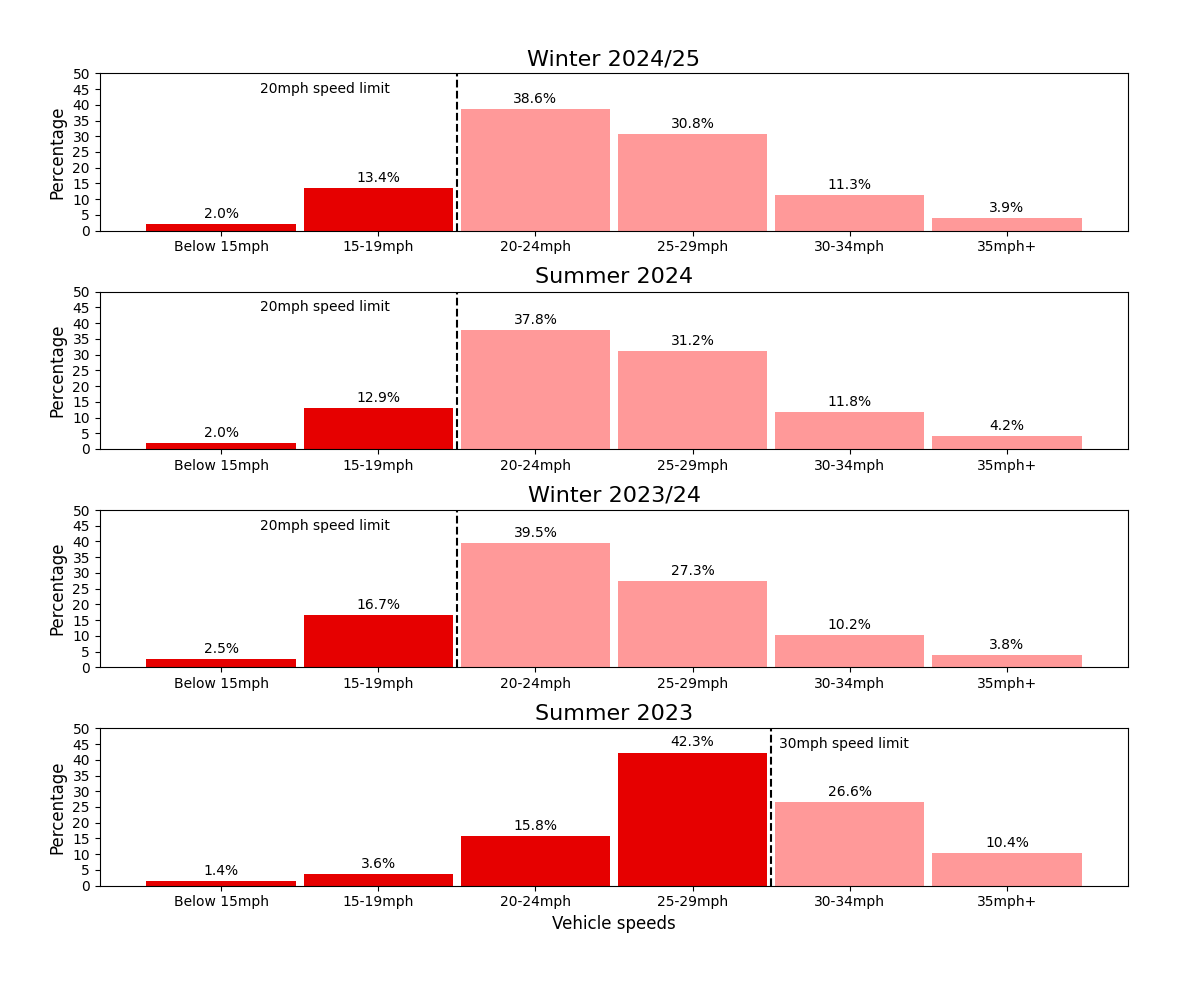
Figure 1: Speed distribution by monitoring period
Background information
This release summarises the vehicle speed data from selected monitoring sites across Wales. All roads monitored had a 30mph speed limit before 17 September 2023 and a 20mph speed limit from 17 September 2023 onwards. At the time of monitoring, all roads were largely free from physical restrictions or obstructions that reduce traffic speeds.
The analysis is based on a total of sixteen weeks of speed monitoring in:
- Summer 2023 - four weeks of data pre-implementation covering two weeks in July and two weeks in September.
- Winter 2023/4 - four weeks of post-implementation data, covering two weeks in November and two weeks in January.
- Summer 2024 - four weeks of post-implementation data, covering two weeks in July and two weeks in September.
- Winter 2024/5 - four weeks of post-implementation data, covering two weeks in November and two weeks in January.
The summer 2023 and summer 2024 data compare like-for-like periods before and after the implementation of the default 20mph speed limit on restricted roads policy.
The winter 2023/24 and winter 2024/25 data compare like-for-like periods after the implementation of the default 20mph speed limit on restricted roads policy.
Local Authorities are reviewing feedback from people, business and communities as part of the National Listening Programme and may decide to change the speed limit on individual roads back to 30mph.
We anticipate this to affect several roads used for speed monitoring. As such, future 20mph speed monitoring may include several revisions to exclude roads that have reverted to 30mph. The impact of these changes will be explained clearly when they occur.
Locations for speed monitoring
Vehicle speed monitoring data by site
Data presented in Table 5 are the share of vehicles, by site and monitoring period, that were recorded travelling at or below 19mph.
This differs from the data that we use to assess compliance with the 20mph speed limit. As detailed in Section 3.1 of the National monitoring report for the sole purpose of monitoring the effects of the default 20mph speed limit, compliance with the 20mph speed limit is taken to be vehicles travelling at or below 24mph.