Default 20mph speed limit on restricted roads | National monitoring report (July 2025)
Default 20mph speed limit on restricted roads
Vehicle journey times February 2023 to November 2024
National monitoring report
Revision Final
Issue Date 15 July 2025
Executive summary
This report reviews data on the effects of the 20mph default speed limit, covering the 18 months following policy implementation in September 2023.
The 20mph default speed limit aims to promote the safety and well-being of people in Wales by reducing the likelihood and severity of road collisions and encouraging walking, wheeling and cycling for shorter journeys in built-up areas. It is also expected to contribute to stronger communities and improved mental and physical health.
This report assesses changes in key performance indicators (KPIs) set out in the 20mph National Monitoring Framework.¹ It covers KPIs on vehicle speeds, journey times and journey time reliability, interactions between pedestrians and vehicles at pedestrian crossings and air quality. The report considers the most recent data for these KPIs, collected up to March 2025.
A summary of available data on casualties on the road network is also presented to provide a preliminary indication of effects of the policy, using data for the 12 months before and after the introduction of the speed limit.²
Research on public attitudes to the 20mph limit will be conducted through a separate policy evaluation commissioned by the Welsh Government, so data for the associated KPIs is not available for this report. Data for the carbon emissions KPI is also not yet available and methodologies to provide this are currently being reviewed.
Table 1 summarises the results for each of the KPIs reviewed. Key findings include:
- Vehicle speeds on 20mph main through roads have fallen by an average of 3.8mph.
- 54.0% of vehicles are now being driven at or below 24mph, compared to 20.8% before implementation. These reductions are expected to lower risk of collisions and the severity of resulting injuries.
- Within the context of a marked overall reduction, average speeds increased marginally from winter 2023/24 (the period immediately after implementation) to winter 2024/25 (the most recent period for which speed data is available).
- Average journey times have been assessed for 15 routes, in the morning and evening and in each direction (60 journey times in total). Average journey time increased in 57 out of 60 cases, but in majority of cases (44 out of 57) by no more than two minutes. Journey time variability has reduced in 45 out of 60 cases, providing greater certainty on how long a particular journey will take.
- Monitoring of vehicle and pedestrian interactions at pedestrian crossings so far is inconclusive in demonstrating an effect from the new speed limit.
- Air quality monitoring data is only currently available for the phase 1 areas where the 20mph was initially piloted, with data up to April 2024. This did not reveal any material difference in nitrogen dioxide concentrations between areas inside and outside the 20mph limit.
- Although it is considered too early to meaningfully assess trends in pedestrian and cyclist casualties, there has been a decrease in overall road casualties, which fell by 11.8% in the four quarters after implementation of the policy.
¹ Transport for Wales, Default 20mph speed limit on restricted roads: Monitoring Framework Document, 2023
² It is advisable for at least three years’ worth of collision data to be used post-implementation to allow for meaningful comparisons with at least a three-year pre-implementation period, following the approaches recommended by the Royal Society for the Prevention of Accidents (RoSPA (2002) Road Safety Engineering Manual, RoSPA: London).
Table 1: KPI assessment summary
| KPI | KPI description | Assessment | Baseline period | Most recent period |
| 1.1 | Percentage travelling at or below 24mph (as a proxy for compliance with the 20mph speed limit) | Increase from 20.8% (pre-implementation) to 54.0% travelling at or below 24mph | Summer 2023 | Winter 2024/25 |
| 1.2 | Change in 85th percentile speed | 3.4mph reduction in speed | Summer 2023 | Winter 2024/25 |
| 1.3 | Change in mean speed | 3.8mph reduction in speed | Summer 2023 | Winter 2024/25 |
| 1.4 | Vehicle journey times and journey time variability, based on the difference between the 5th and 95th percentile journey times as a proxy for journey time reliability, on main through routes | Increase in average journey times Decrease in journey time variability (i.e. improved journey time reliability) | Spring 2023 | Autumn 2024 |
| 2.1, 2.2, 2.3 | Reduce the number of pedestrians and cyclists killed or seriously injured on the road network³ | In the first 12 months after the introduction of the default 20mph speed limit, there was a 11.8% decrease in total casualties. Casualties on 20 and 30mph roads decreased by 26.2% while casualties on >40mph roads increased by 4.2%. Lack of sufficient data at this stage to be able to assess trends in pedestrian and cyclist casualties. | 2022 Q4 to 2023 Q3 | 2023 Q4 to 2024 Q3 |
| 3.2 | Change in vehicle and pedestrian yielding behaviours | Inconclusive at this stage, as changes in yielding behaviours varied between sites assessed | 2023 (February to March) | 2025 (February to March) |
| 4.1 | Change in local air quality - NO2 | No material effect identified | May 2022 | April 2024 |
³ Collision data for pedestrians and cyclists cannot yet be meaningfully assessed, as three years’ of post-implementation data is required, following the approaches recommended by the Royal Society for the Prevention of Accidents (RoSPA: RoSPA (2002) Road Safety Engineering Manual, RoSPA: London). Instead, data for the total number of road casualties is presented.
1. Introduction
1.1. Background
Following an initial phase 1 trial of the 20mph speed limit in selected areas, the Welsh Government extended the limit to all restricted roads in Wales on 17 September 2023. This is the first national policy of its kind in the UK and there has been keen public interest in its effects.
Transport for Wales (TfW) works with the Welsh Government and highway authorities to assess these effects by monitoring changes in a predefined list of key performance indicators (KPIs). These KPIs are set out in the national 20mph monitoring framework and are summarised in section 2 of this report.⁴
This report builds on the previous monitoring document published in September 2024 and is the first assessment where at least one full year of post-implementation data is available for some KPIs. The data was collected at a range of locations and includes:
- Vehicle speed monitoring data
- Data on journey times and journey time reliability
- Yielding analysis to assess interactions between pedestrians and vehicles at pedestrian crossings in 20mph areas
- Air quality monitoring data from phase 1⁵
- Road traffic accident casualty data.⁶
1.2. Rationale for intervention
Reducing traffic speeds is intended to benefit communities and promote the safety and well-being of people in Wales. Introducing a lower speed limit is expected to reduce the likelihood and severity of collisions on the roads, with fewer pedestrians and cyclists being seriously or fatally injured. The reduced speed limit also aims to support the Welsh Government’s vision for walking, wheeling and cycling to be the natural mode of choice for short, everyday journeys.⁷
By reducing the number of injuries and fatalities on roads and reducing the negative effects of car use on the wider environment, the change to 20mph is anticipated to have further wide-reaching benefits. These include:
- More people choosing to walk, wheel or cycle (for example, use active travel modes), reducing the number of short distance car journeys in built-up areas
- Enhanced social interaction within and between communities, due to safer streets that facilitate walking and crossing, thereby fostering social cohesion
- Improved physical and mental health outcomes due to increased physical activity and greater social interaction
- Reduced NHS and taxpayer costs and reduced NHS workload due to fewer road collisions (and reduced severity of injuries and trauma)
- Reduced NHS costs resulting from the improved physical and mental health brought about by increased active travel
- Strengthened local economies in areas previously affected by traffic speed issues, as a result of increased footfall and therefore increased retail and hospitality sector activity
- Contribution to the aims of the Well-Being of Future Generations (Wales) Act 2015, in particular to enable places to support the health and well-being of people and communities.
While these wide-reaching benefits are anticipated, they cannot easily be measured and attributed to a single policy intervention. This is because there are a broad range of other influencing factors, including other Welsh Government interventions that aim to achieve similar benefits.
A separate policy evaluation has been commissioned by the Welsh Government to identify the distinct impact of the 20mph policy compared to other factors. In the interim, the KPIs in the 20mph monitoring framework provide an indication of its effects.
⁴ Transport for Wales, Default 20mph speed limit on restricted roads: Monitoring Framework Document, 2023
⁵ A summary and full air quality reports are published at https://tfw.wales/about-us/transparency/publications/default-20mph-speed-limit
⁶ StatsWales, Casualties by speed limit and severity, 2025
⁷ This vision is set out in the Active Travel Act Guidance (July 2021).
2. Objectives and key performance indicators
2.1. Monitoring framework overview
The national 20mph monitoring framework (September 2023) sets out three core objectives for implementing 20mph as the default speed limit on restricted roads:
- Reduce injury and death
- Encourage a change in travel behaviour
- Reduce negative effects of vehicle use on the wider environment.
The three core objectives are linked to five specific measurable objectives for 20mph speed limit implementation (see figure 1). These objectives are:
- Reduce the number of pedestrians and cyclists killed or seriously injured on the road network
- Encourage a mode shift from private cars to walking and cycling for shorter journeys in built-up areas
- Reduce motor vehicle dominance in vehicle and pedestrian interactions
- Reduce carbon emissions from transport as a result of mode shift from private cars to walking, wheeling and cycling for shorter journeys in built-up areas
- Maintain or improve local air quality due to smoother traffic speeds with less acceleration and deceleration.
Figure 1: Objectives of the default 20mph speed limit
| Policy measure: Reduce default speed limit on restricted roads to 20mph | ||
Improve the well being of people in Wales (health outcomes, social interaction, NHS costs, local economies) | Reduce injury and death | Reduce the number of pedestrians and cyclists killed or seriously injured on the road network |
| Encourage a change in travel behaviour | Encourage mode shift from private car to walking and cycling for shorter journeys in built-up areas | |
| Reduce motor vehicle dominance in vehicle and pedestrian interactions | ||
| Reduce negative effects of vehicle use on the wider environment | Reduce carbon emissions from transport | |
| Maintain or improve local air quality | ||
Monitoring progress towards these objectives is undertaken by assessing 12 KPIs, as set out in figure 2.
Figure 2: KPIs for assessing the effects of default 20mph speed limit implementation
| Objectives | Key performance indicators (KPIs) | ||
| 1.1: Traffic compliance with 20mph speed limit | 1.2: Change in 85th percentile speed | 1.3: Change in mean speed | |
| 1.4: Vehicle journey times and journey time variation on main through routes (difference between 5th and 95th percentile journey times) | |||
| Reduce the number of pedestrians and cyclists killed or seriously injured on the road network | 2.1: Casualty rate for child pedestrians (aged 5-11 years), by sex and deprivation fifth, also by sex and urban/rural | 2.3: Casualty rate for older pedestrians and cyclists (aged over 75 years), by sex and deprivation fifth, also by sex and urban/rural | |
| 2.2: Casualty rate for pedestrians and cyclists aged 12-74, by sex and deprivation fifth, also by sex and urban/rural | |||
| Encourage mode shift from private car to walking and cycling | 3.1: Change in attitude to active travel use in built-up areas | 3.2: Change in vehicle and pedestrian yielding behaviours | |
| Reduce motor vehicle dominance in vehicle and pedestrian interactions | |||
| Reduce carbon emissions from transport Maintain or improve local air quality | 4.1: Change in local air quality - NO2 | 4.2: Change in CO2 emissions | |
| 5.1: Change in public attitudes to 20mph speed limits | |||
2.2. National roll-out monitoring
The following six KPIs are assessed in this report:
- KPI 1.1 - Traffic compliance with the 20mph speed limit. This uses the percentage of vehicles travelling at or below 24mph as a proxy for compliance⁸
- KPI 1.2 - Change in 85th percentile speed⁹
- KPI 1.3 - Change in average (mean) speed
- KPI 1.4 - Vehicle journey times and journey time variation on main through routes. This uses the difference between the 5th percentile and 95th percentile journey times as an indicator of journey time reliability¹⁰
- KPI 3.2 - Change in vehicle and pedestrian yielding behaviours
- KPI 4.1 - Change in local air quality based on nitrogen dioxide (NO2) concentrations
The remaining six KPIs are not reported on here, for the following reasons:
- KPIs 2.1, 2.2, 2.3 - Casualty rates for pedestrians and cyclists. It is recommended that at least three years’ worth of collision data will be required post-implementation to allow for meaningful comparisons with at least a three-year pre-implementation period.¹¹ It is therefore too early to report against these indicators. Instead, this report presents data on the total number of casualties reported to police in 2023 and 2024.
- KPI 3.1 - Change in attitudes to active travel use in built-up areas. This KPI was initially assessed in 2022 through Welsh Government research on active travel journeys to primary schools. A summary of previous findings is provided in this report for reference. While more recent data is not yet available, the Welsh Government has commissioned a full evaluation of the 20mph policy which will include new research on this KPI.
- KPI 5.1 - Change in public attitudes to 20mph speed limits. This KPI will consider perceptions of traffic speeds, noise and effects on communities and will also be assessed through the Welsh Government evaluation.
- KPI 4.2 - Change in carbon dioxide (CO2) emissions. Data is not yet available for this KPI. However, Transport for Wales is currently reviewing potential methodologies to assess the impacts of the 20mph policy on CO2 emissions.
⁸ Currently, vehicles travelling under 26mph are usually considered compliant with the speed limit in Wales for enforcement purposes. However, it is anticipated that in future vehicles may need to travel below 24mph to be deemed compliant, aligning with the rest of the UK.
⁹ The speed at or below which 85% of drivers drive, under free-flowing conditions.
¹⁰ The 5th percentile is the journey time below which 5% of all recorded journey times fall over a given distance. The 95th percentile is the journey time under which 95% of journeys fall. The difference between them is a measure of journey time variability.
¹¹ RoSPA (2002) Road Safety Engineering Manual, RoSPA: London.
3. Monitoring results
3.1. Traffic speeds
Locations and method
Traffic speed monitoring devices were installed at 43 locations across 10 areas. They provided data for the following KPIs:
- Traffic compliance with the 20mph speed limit (KPI 1.1)
- Change in 85th percentile speed (KPI 1.2)¹²
- Change in mean speed (KPI 1.3)
Table 2 lists the locations for speed monitoring. Maps are available in Annex A - available as a separate document on the TfW website.
Data was collected using monitoring devices installed across the carriageway on main through roads in each area. All roads monitored had a 30mph speed limit before 17 September 2023 and a 20mph speed limit afterwards. At the time of monitoring, roads were free from roadworks and other physical restrictions (such as traffic calming measures) that might reduce traffic speeds.
Pre-implementation speed data was collected over four weeks during July and early September 2023 (this period is referred to as summer 2023). In the Torfaen area (Cwmbran, Pontypool and Blaenavon), a shorter period of data collection took place over one week in early 2023¹³.
Post-implementation speed data has been collected in three phases from November 2023 to January 2025, as follows:
- Winter 2023/24: four weeks of data collected between November 2023 and January 2024, excluding the Christmas and new year holiday period
- Summer 2024: four weeks of data collected during July 2024 and September 2024
- Winter 2024/25: four weeks of data collected between November 2024 and January 2025, excluding the Christmas and new year period.
Changes in the mean and 85th percentile speeds within each area are weighted by traffic flows on each road.
¹² The speed at which 85% of drivers drive at or below, under free-flowing conditions.
¹³ Summer 2023 data collection in Torfaen was commissioned directly by Torfaen County Borough Council.
Table 2: Number and location of speed monitoring devices
| Area | Number of speed monitoring locations |
| Lampeter | 4 |
| Penrhyn Bay¹⁴ | 3 |
| Llanrug | 3 |
| Allt-yr-yn (Newport) | 3 |
| Pembroke Dock | 3 |
| Newtown | 4 |
| Tylorstown and Pontygwaith | 4 |
| Torfaen (Cwmbran, Pontypool and Blaenavon) | 8 |
| Wrexham | 10 |
| Peniel | 1 |
¹⁴ For the first monitoring report released in September 2024, there were four sites at Penrhyn Bay. One of these sites has since been excluded from published datasets as the road retained the 30mph speed limit after implementation. As a result, for each of the speed KPIs, the summer 2023 figures may vary slightly between this monitoring report and the previous report.
Headline assessment
Table 3 presents traffic speed KPI assessments based on data collected between July 2023 and January 2025.
Any speed reduction is a positive step towards achieving wider wellbeing, given that it reduces both the likelihood of collisions and the severity of resulting injuries.¹⁵
Table 3: Traffic speed KPIs, pre- and post-implementation
| KPI | Summer 2023 (pre) | Winter 2023/24 (post) | Summer 2024 (post) | Winter 2024/25 (post) | Change summer 2023 to winter 2024/25 |
| 1.1 Percentage travelling at or below 24mph (as a proxy for compliance with the 20mph speed limit) | 20.8% | 58.7% | 52.7% | 54.0% | 33.2 percentage point increase |
| 1.2 Change in 85th percentile speed | 32.9 mph | 29.1 mph | 29.8 mph | 29.5 mph | 3.4 mph reduction |
| 1.3 Change in mean speed | 28.7 mph | 24.4 mph | 25.1 mph | 24.9 mph | 3.8 mph reduction |
¹⁵ A study from 2000 found that every 1mph reduction in urban mean speeds is associated with a reduction in the frequency of collisions of between 2% and 7%. Source: Taylor, M., Lynam, D., Baruya, A. (2000) The effects of drivers’ speed on the frequency of road accidents, Crowthorne, TRL
Speed limit compliance (KPI 1.1)
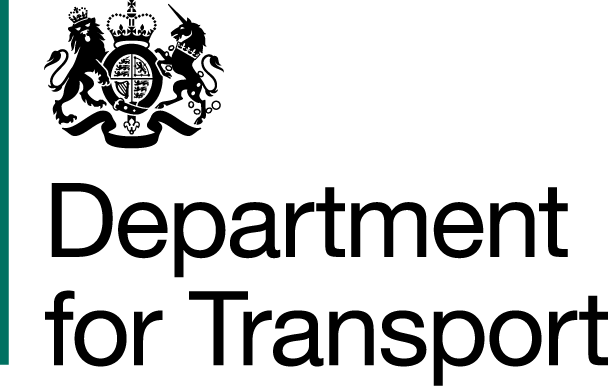
For KPI 1.1, anyone driving at or below 24mph is considered to be compliant with the new speed limit for the purpose of this report. Figure 3 shows the change in the proportion of vehicles travelling at or below 24mph in each area. The overall weighted mean is weighted by traffic flow in each area. This proportion increased from 20.8% in summer 2023 (pre-implementation) to 54.0% in winter 2024/25.
There has been some fluctuation over time (58.7% in winter 2023/24, 52.7% in summer 2024 and then 54.0% in winter 2024/25), but overall there has been a significant and sustained increase in vehicles being driven at or below 24mph.¹⁶
Figure 3: Percentage of vehicles travelling at or below 24mph, summer 2023 to winter 2024/25
The largest change was observed in Peniel, with the percentage of vehicles travelling at or below 24mph increasing by 50.6 percentage points, from 9.9% to 60.5% (summer 2023 to winter 2024/25). The smallest change was in Tylorstown, with an increase of 21.0 percentage points.
¹⁶ Actual values are shown in figure 3 for the overall weighted mean only, rather than for each individual area, to ensure reasonable visual clarity.
Speed distributions
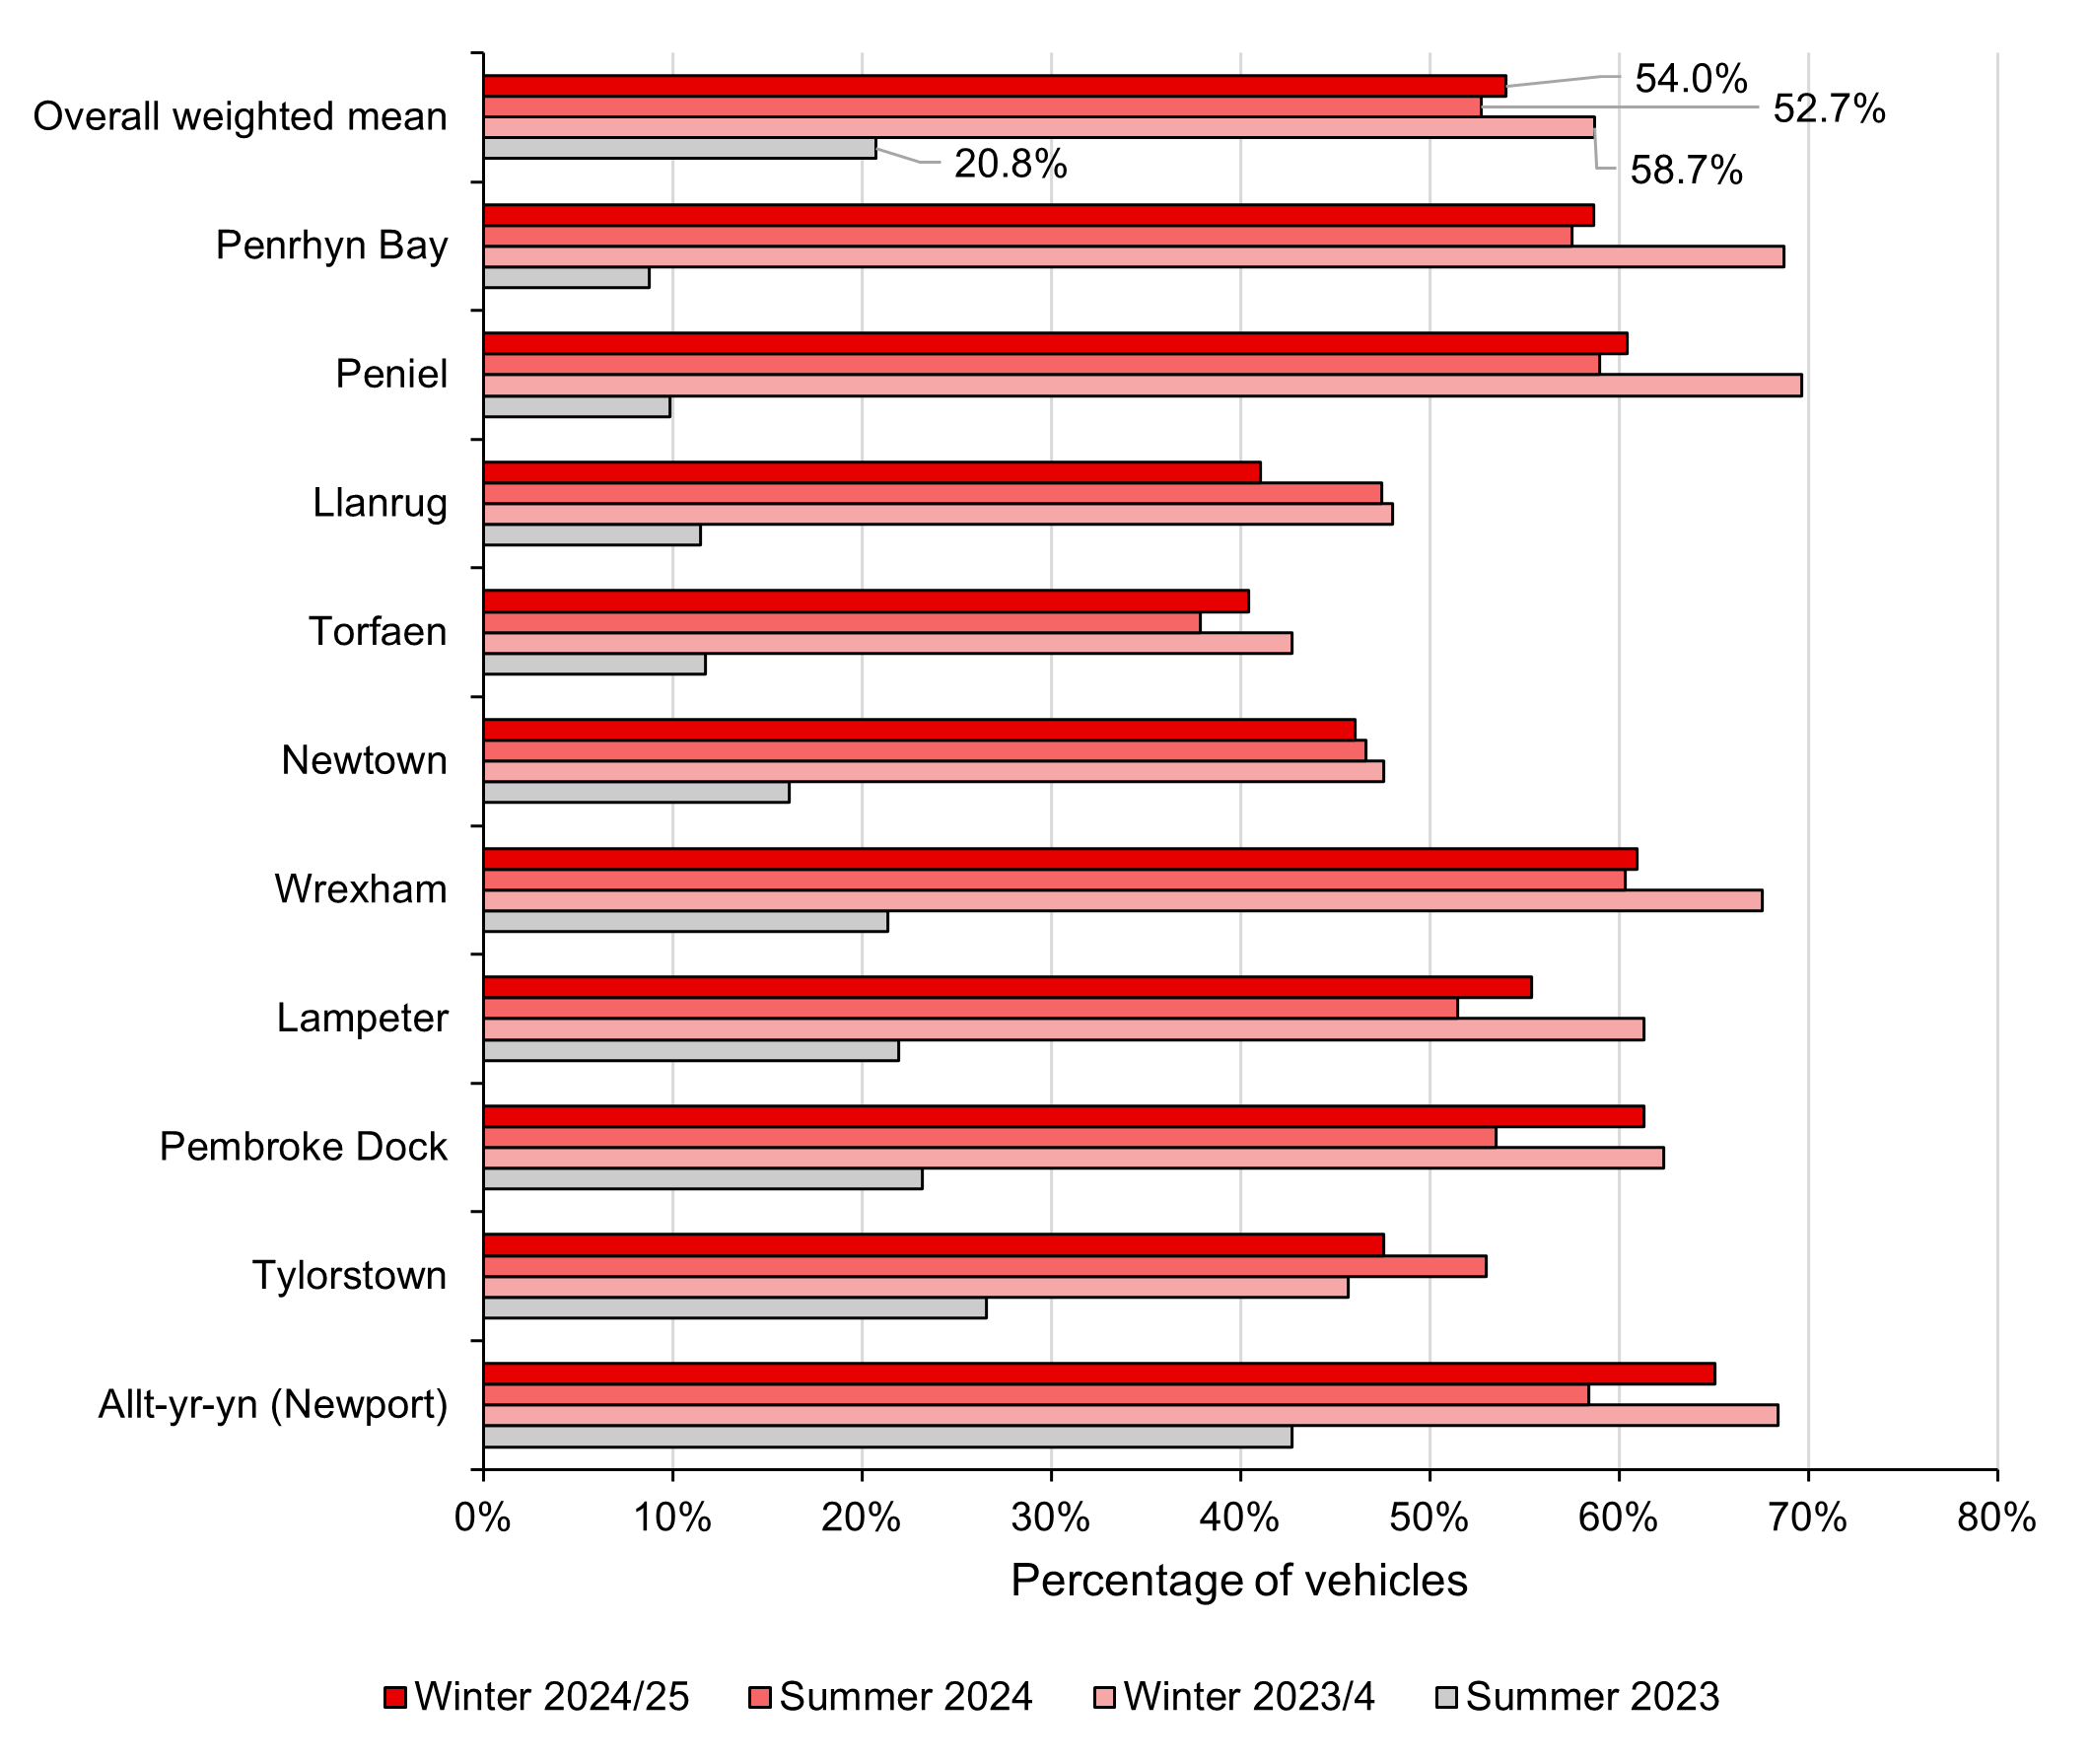
Figure 4 shows how the percentage of drivers in different speed bands has changed since implementation of the policy. Between summer 2023 and winter 2024/25, the proportion of vehicles driving between 20-24mph increased from 15.8% to 38.6%, and the proportion of vehicles driving over 24mph fell from 79.3% to 46.0%.
These changes reflect a general slowing down of traffic speeds. This is the case even among those drivers driving substantially over the speed limit, illustrated by the percentage of vehicles travelling at 35mph or above falling from 10.4% to 3.9%.
Figure 4: Proportion of vehicles travelling in different speed brackets, summer 2023 to winter 2024/25
85th percentile speeds (KPI 1.2)
This KPI measures the speed at or below which 85% of the observed vehicles are travelling and is a standard measure used in evaluating speed limits. Unlike the mean speed measure, it is unaffected by a small proportion of drivers travelling at high speeds well above the limit.
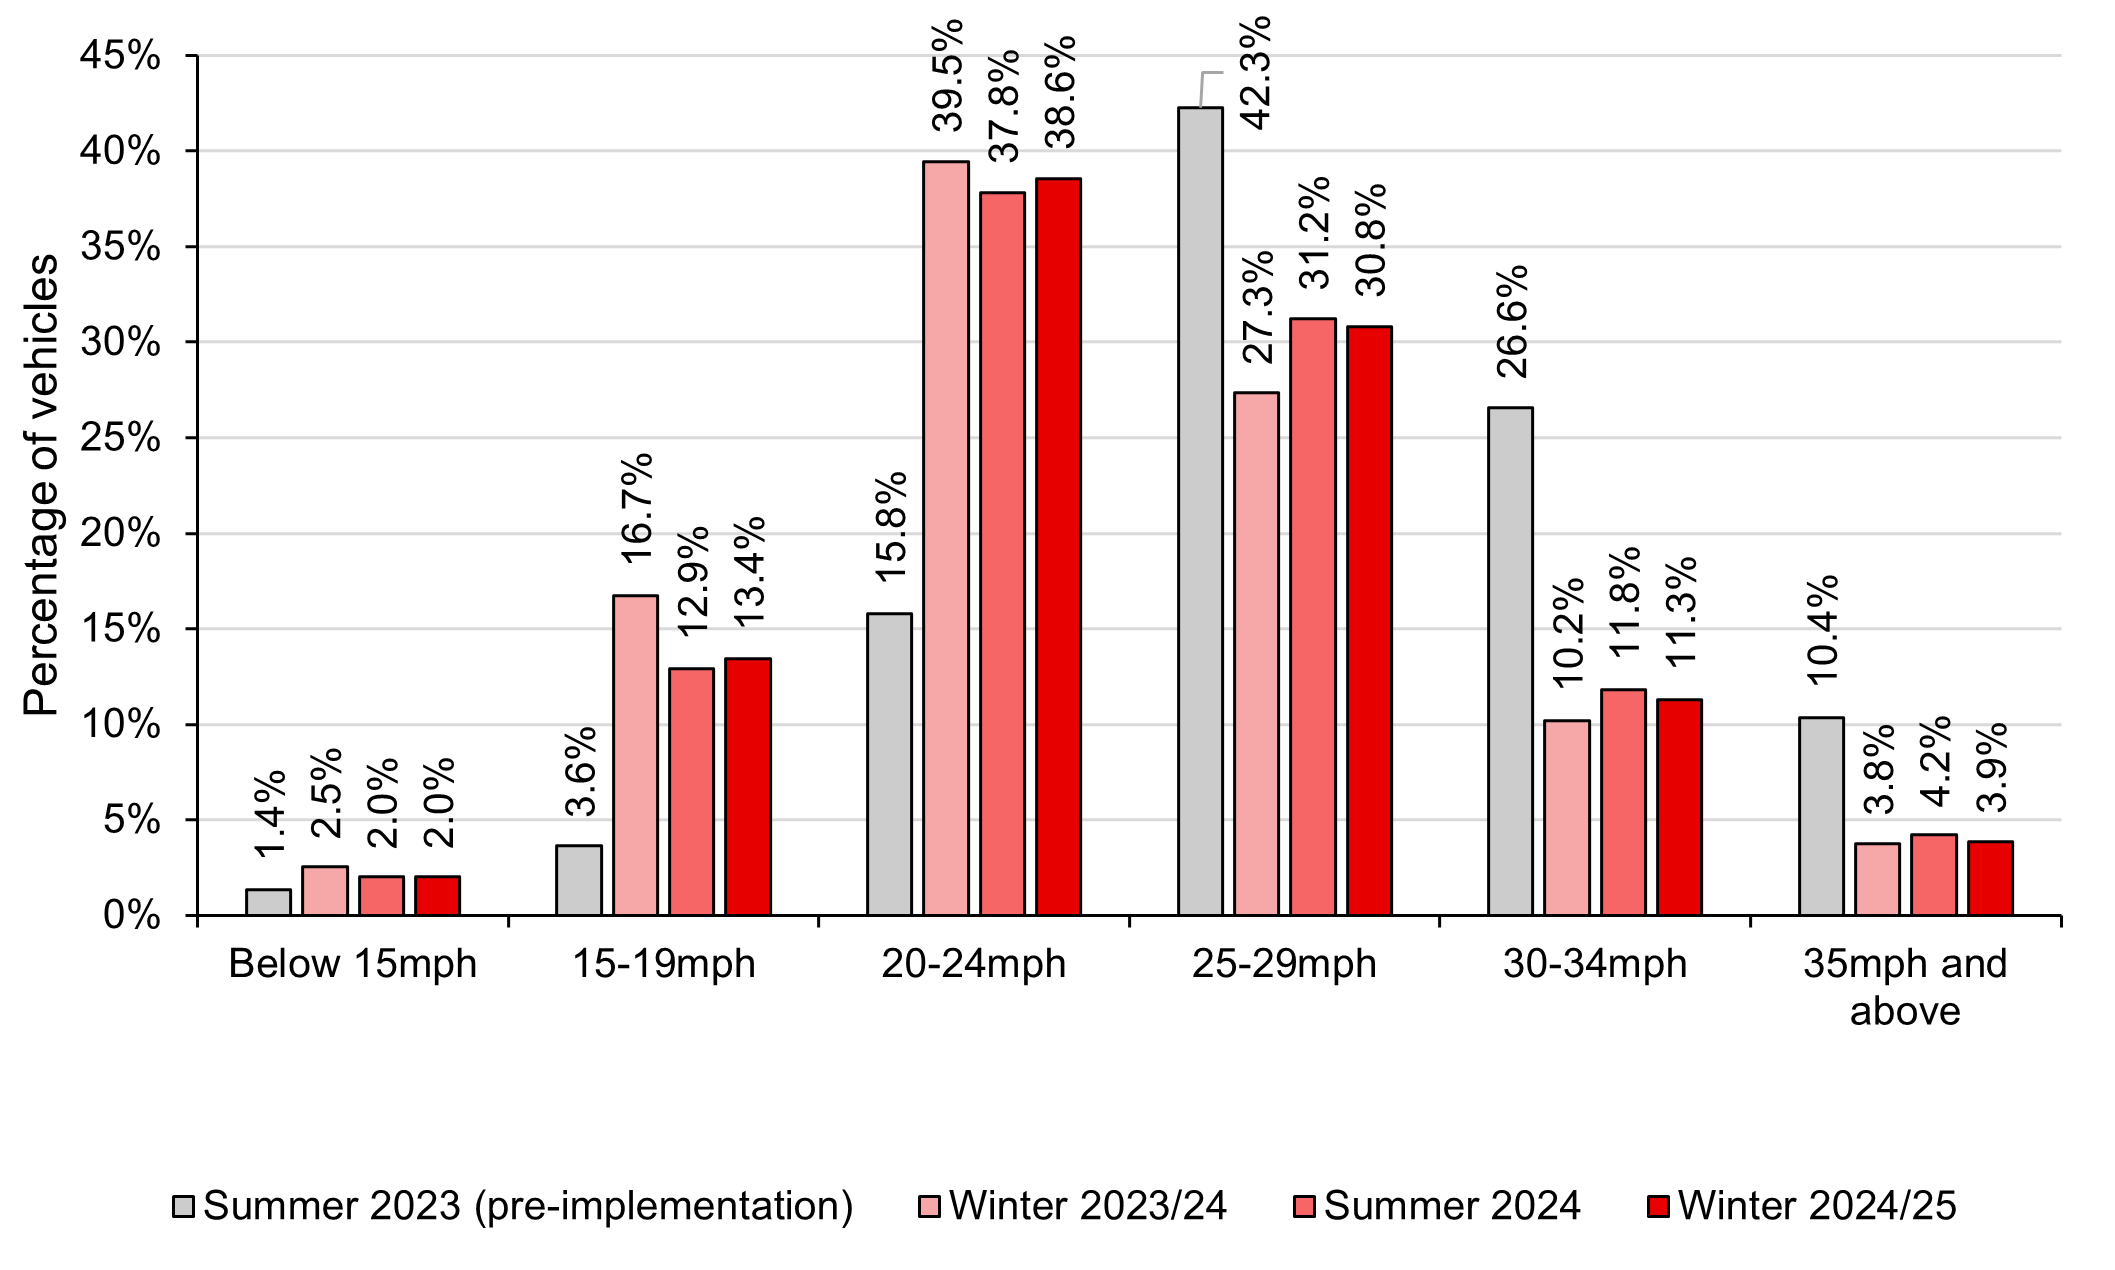
Comparing the most recent period (winter 2024/25) with the pre-implementation period (summer 2023), 85th percentile speeds reduced in all areas, as illustrated in figure 5. The results showed that:
- 85th percentile speeds have reduced by 3.4mph on average, from 32.9mph to 29.5mph
- The largest reductions in 85th percentile speeds were observed in Peniel¹⁷ (-5.2mph), Pembroke Dock (-4.9mph) and Lampeter (-4.7mph)
- The smallest reduction was in Allt-yr-yn (Newport) (-2.3mph)
Figure 5: 85th percentile speeds, summer 2023 to winter 2024/25
¹⁷ Peniel’s data was revised in the December 2024 publication to correct for a small error in the way the 85th percentile was calculated for the site.
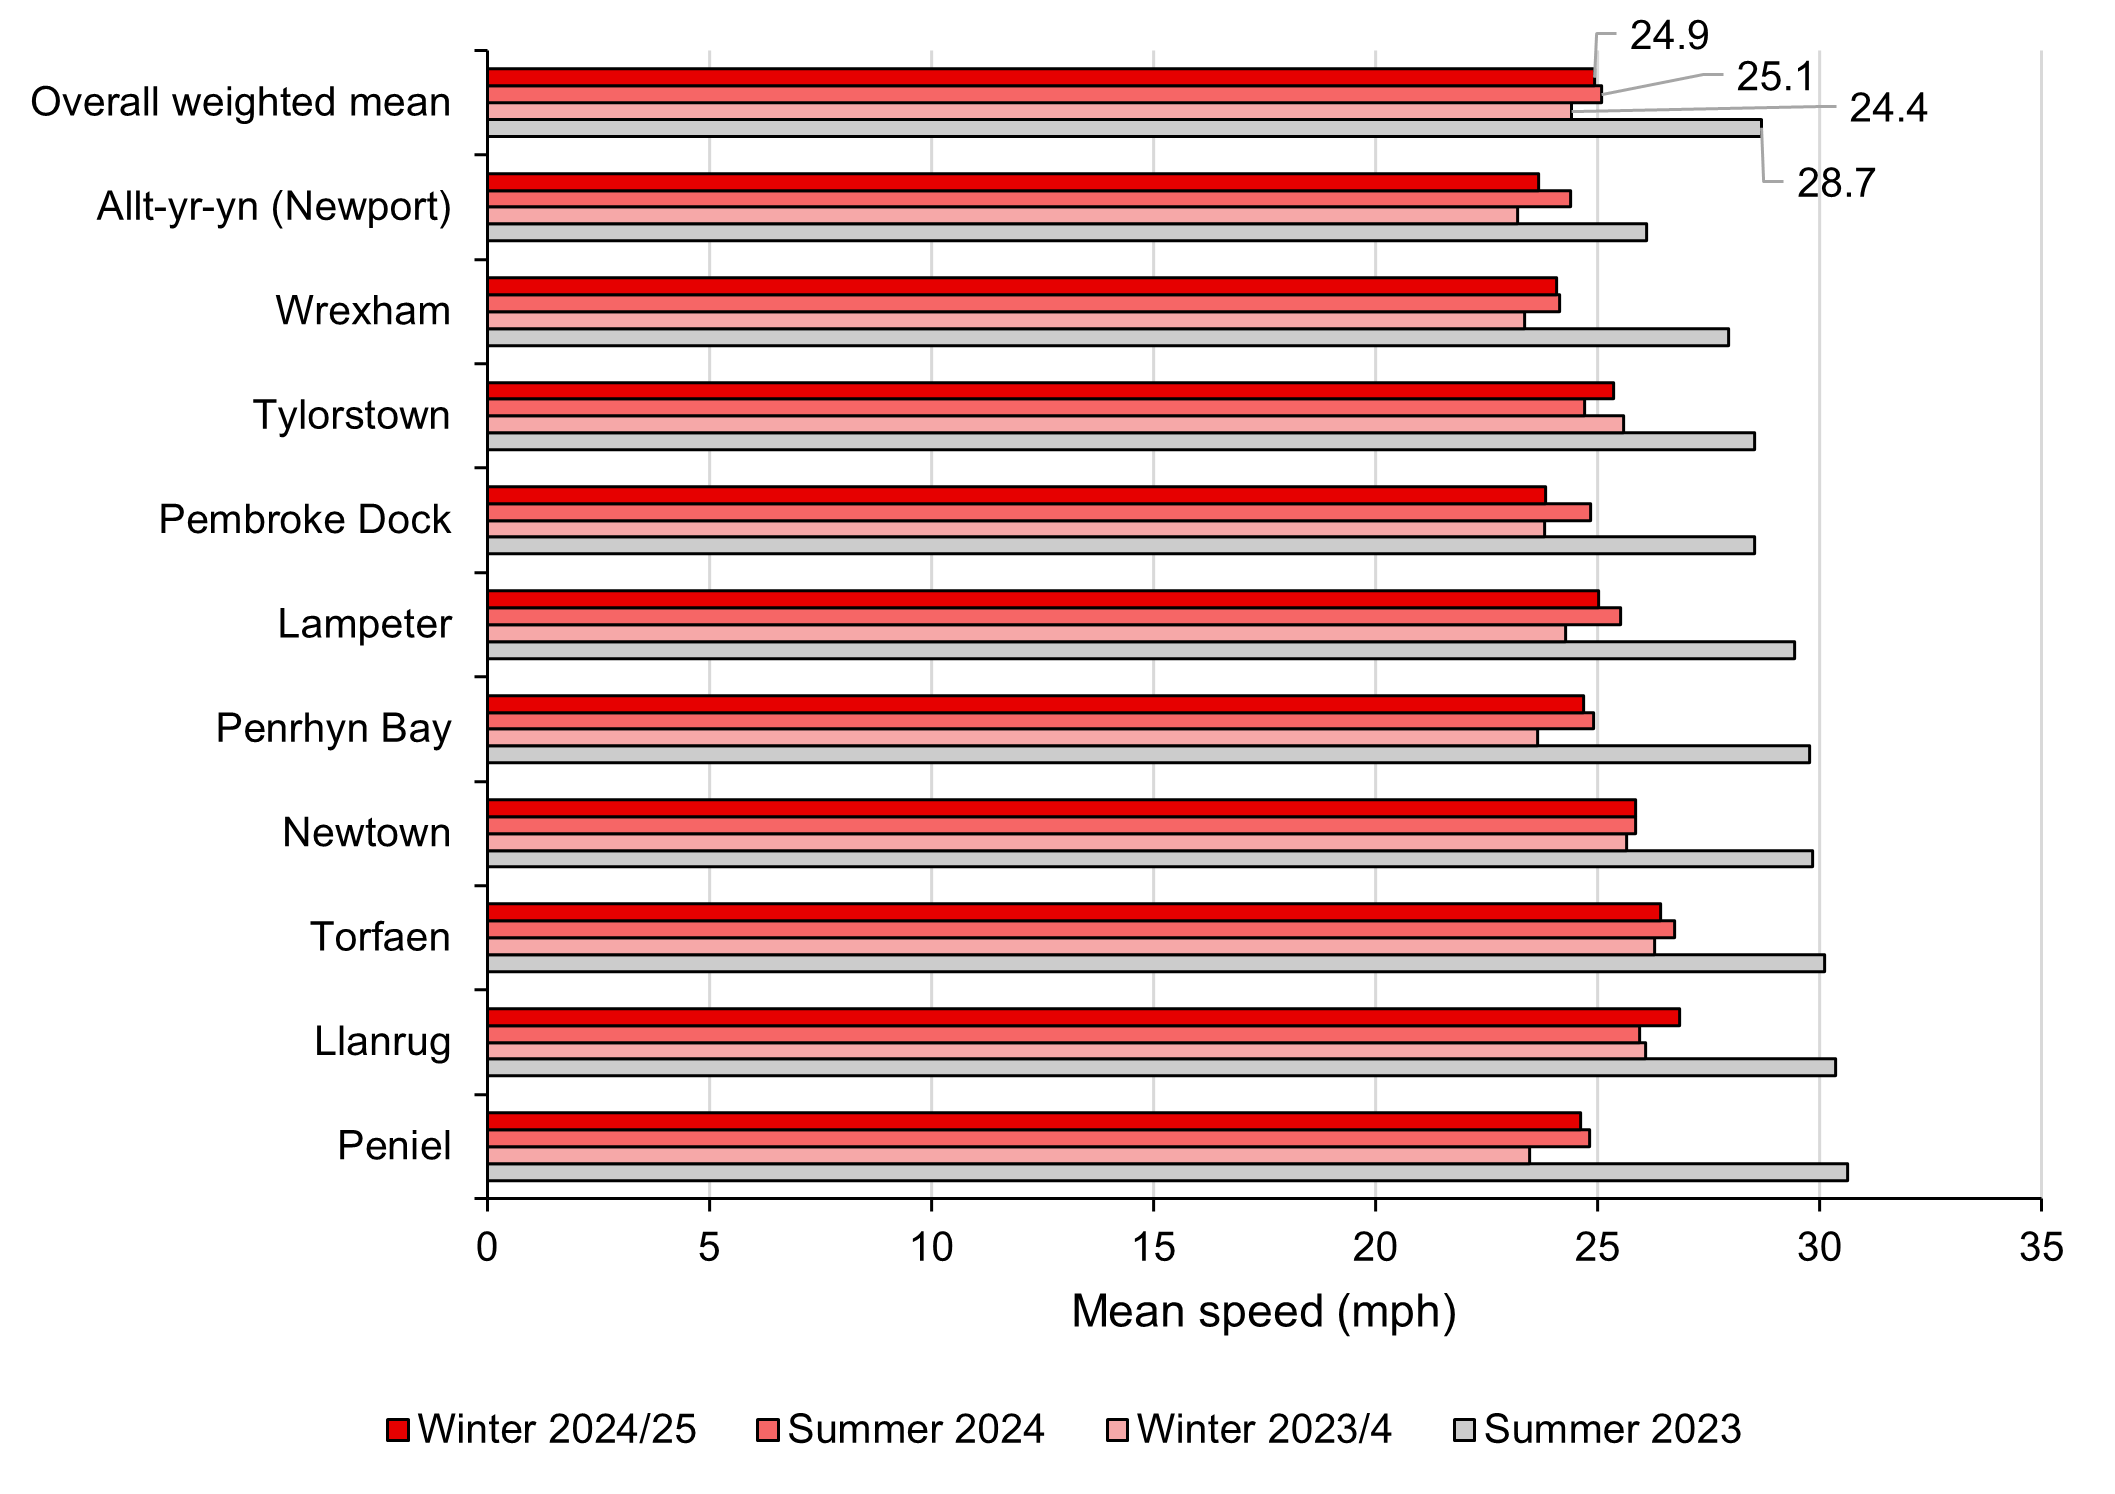
Mean speeds (KPI 1.3)
Figure 6 compares mean speeds over time since the implementation of the default speed limit policy in September 2023. The overall weighted mean speed in the most recent period (winter 2024/25) was 24.9 mph, which is a 3.8mph decrease compared with summer 2023 (pre-implementation). The most significant decreases were at Peniel (-6.0mph), Penrhyn Bay (-5.1mph) and Pembroke Dock (-4.7mph).
There has been some fluctuation in mean speeds over time (24.4mph in winter 2023/24, 25.1mph in summer 2024 and then 24.9mph in winter 2024/25). Overall, however, there has been a significant and sustained fall in mean speeds relative to the pre-implementation period.
Figure 6: Mean speeds, summer 2023 to winter 2024/25
Traffic speed trends
Table 4 presents mean speeds recorded in all ten monitoring areas immediately after the 20mph speed limit national roll-out in September 2023, and in subsequent monitoring periods through to January 2025. The overall weighted mean speed is presented in figure 7. This shows that following the introduction of the speed limit the weighted mean fell substantially and has remained relatively stable.
Table 4: Trends in mean speeds (mph), July 2023 to January 2024
| Area | July 2023 (Pre) | Sep 2023 (Pre) | Nov 2023 (Post) | Jan 2024 (Post) | July 2024 (Post) | Sep 2024 (Post) | Nov 2024 (Post) | Jan 2025 (Post) |
| Lampeter | 30.2 | 28.7 | 24.1 | 24.4 | 25.3 | 25.7 | 24.8 | 25.2 |
| Penrhyn Bay | 30.0 | 29.6 | 23.8 | 23.5 | 24.5 | 25.3 | 24.8 | 24.6 |
| Llanrug | 30..3 | 30.4 | 26.6 | 25.7 | 25.8 | 26.1 | 27.1 | 26.6 |
| Allt-yr-yn (Newport) | 27.1 | 25.4 | 23.1 | 23.3 | 24.6 | 24.2 | 24.1 | 23.0 |
| Pembroke Dock | 28.1 | 29.0 | 24.1 | 23.5 | 24.6 | 25.1 | 23.8 | 23.9 |
| Newtown | 29.2 | 30.4 | 25.7 | 25.6 | 25.8 | 25.9 | 25.5 | 26.2 |
| Tylorstown | 29.9 | 27.2 | 25.7 | 25.5 | 23.9 | 25.5 | 25.1 | 25.7 |
| Torfaen | 30.1 | * | 26.2 | 26.4 | 27.0 | 26.4 | 26.4 | 26.4 |
| Wrexham | 28.4 | 27.5 | 23.2 | 23.5 | 24.2 | 24.1 | 24.3 | 23.9 |
| Peniel | 31.5 | 29.7 | 23.2 | 23.7 | 24.8 | 24.9 | 24.6 | 24.6 |
| Overall weighted mean | 29.2 | 28.2 | 24.4 | 24.4 | 25.0 | 25.2 | 25.0 | 24.9 |
* Data not collected in Torfaen in this period.
Figure 7: Mean speed trends, July 2023 to January 2025, weighted mean (all areas)

(a) The speed limit on roads being monitored changed from 30mph to 20mph on 17 September 2023. Data from November 2023 onwards is therefore from roads with a default 20mph speed limit.
Supplementary data - average speeds on A and B roads by time of day
Data from the Ordnance Survey (OS) National Geographic Database Average and Indicative Speed dataset¹⁸ provides a supplementary data source with which to assess changes in mean speeds. The OS dataset is sourced from in-vehicle telematics across a relatively small sample of vehicles, which means that it is likely to be most reliable for the busier A and B classified roads.
While the OS data source provides national coverage, the lower sample size on each road means that it cannot be used to calculate the complete set of speed-related key performance indicators in this report. Furthermore, as the OS data provides the average speed for an entire road link, the data is affected by vehicles travelling at lower speeds when approaching junctions.
The OS data is therefore supplementary to the data obtained from the 43 monitoring sites.
We have obtained the average speeds from the OS data for all A and B roads which had a speed limit of 30mph in April 2023 and 20mph in April 2025, totalling 1,065 km of road¹⁹. The data is from a six-month pre-implementation period ending in April 2023 and a six-month post-implementation period ending in April 2025.
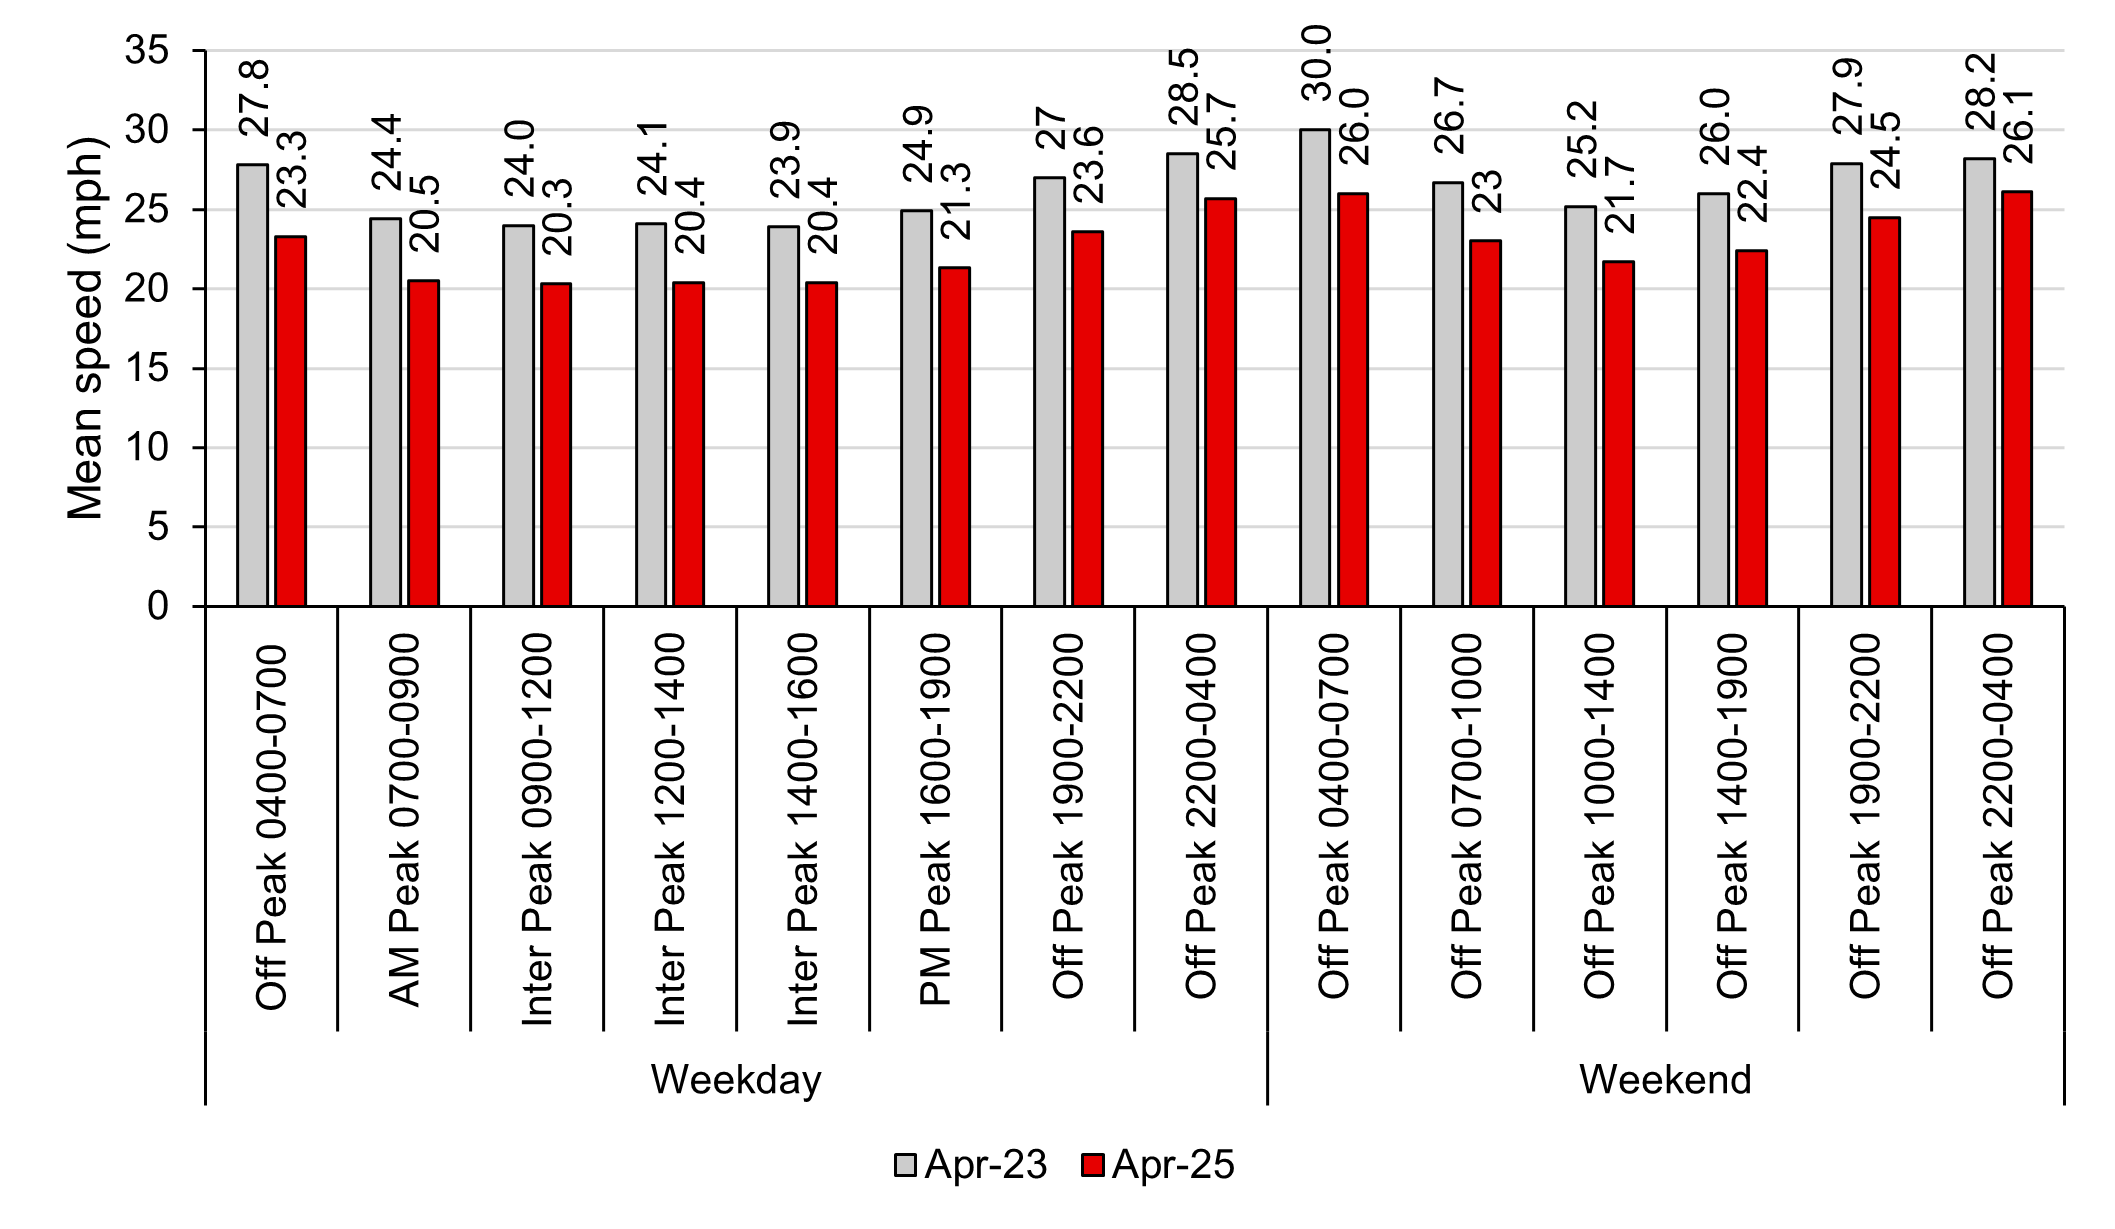
Figure 8 and table 5 show a mean speed reduction in the OS data of between 2.2mph and 4.5mph across all time periods following the implementation of the default 20mph speed limit on restricted roads. This is a similar scale of change to the 3.8mph decrease in mean speeds recorded from the 43 monitoring sites.
Figure 8: Mean speeds by time of day, pre- and post-implementation (OS data)
¹⁸ Average And Indicative Speed | OS National Geographic Database
¹⁹ In this context each km of road means 1km of two-way road.
Table 5: Mean speeds by time of day, pre and post-implementation (OS data)
| Period | Apr-23 | Apr-25 | Difference in mean speed (mph) | Relative change in mean speed |
| Off Peak 0400-0700 Weekday | 27.8 | 23.3 | -4.5 | -16.2% |
| AM Peak 0700-0900 Weekday | 24.4 | 20.5 | -3.9 | -16.0% |
| Inter Peak 0900-1200 Weekday | 24.0 | 20.3 | -3.7 | -15.4% |
| Inter Peak 1200-1400 Weekday | 24.1 | 20.4 | -3.7 | -15.4% |
| Inter Peak 1400-1600 Weekday | 23.9 | 20.4 | -3.5 | -14.6% |
| PM Peak 1600-1900 Weekday | 24.9 | 21.3 | -3.6 | -14.5% |
| Off Peak 1900-2200 Weekday | 27.0 | 23.6 | -3.5 | -12.6% |
| Off Peak 2200-0400 Weekday | 28.5 | 25.7 | -2.8 | -9.8% |
| Off Peak 0400-0700 Weekend | 30.0 | 26.0 | -4.0 | -13.3% |
| Off Peak 0700-1000 Weekend | 26.7 | 23.0 | -3.7 | -13.9% |
| Off Peak 1000-1400 Weekend | 25.2 | 21.7 | -3.5 | -13.9% |
| Off Peak 1400-1900 Weekend | 26.0 | 22.4 | -3.6 | -13.8% |
| Off Peak 1900-2200 Weekend | 27.9 | 24.5 | -3.4 | -12.2% |
| Off Peak 2200-0400 Weekend | 28.2 | 26.1 | -2.2 | -7.4% |
The most significant reduction of 4.5 mph occurred during the 0400-0700 AM period on weekdays, and the smallest reduction of 2.1 mph was observed between 2200 PM and 0400 on weekends. Adherence to the new speed limit is particularly notable during weekdays between 0700 and 1900, with mean speeds below 22 mph.
3.2. Journey time reliability
Headline assessment
Table 6: Journey times and journey time variability KPI assessment
| KPI | KPI description | Assessment |
| 1.4 | Vehicle journey times and journey time variation on main through routes | Overall, there has been an increase in average journey times and a decrease in journey time variability (so journey time reliability has improved) |
Locations and method
Anonymised in-vehicle telematics data (obtained from INRIX) has been used to assess journey times and journey time reliability on 15 routes, listed in table 7. Full details are included in Annex B, provided as a separate document on the TfW website.
The routes were selected to represent a broad range of different types and lengths of routes including inter-urban rural routes, short urban routes, routes to out-of-town destinations, commuter and school routes.
For each of the 15 routes, four average journey times are presented, for each direction and each peak period (AM and PM), so there are 60 average journey times presented in total. These are set out in full in table 17 in Annex C.
Pre-implementation data has been obtained from February to April 2023 (spring 2023) and post-implementation data from February to April 2024 (spring 2024) and then again during September to November 2024 (autumn 2024). Data was obtained for Tuesdays, Wednesdays and Thursdays, also avoiding public holidays around Easter to ensure like-for-like comparisons.
Table 7: Routes used for journey time assessment
| Route | Direction | Route description | Distance (km) |
| 1 | A | Aberystwyth to Cardigan | 61 |
| 1 | B | Cardigan to Aberystwyth | 61 |
| 2 | A | Llandudno to Betws-y-Coed | 29 |
| 2 | B | Betws-y-Coed to Llandudno | 29 |
| 3 | A | Carmarthen to Coleg Sir Gar | 27 |
| 3 | B | Coleg Sir Gar to Carmarthen | 27 |
| 4 | A | Porthmadog to Caernarfon | 32 |
| 4 | B | Caernarfon to Porthmadog | 32 |
| 5 | A | Caerphilly to Newport | 18 |
| 5 | B | Newport to Caerphilly | 18 |
| 6 | A | Wrexham to Deeside (Shotton) | 20 |
| 6 | B | Deeside (Shotton) to Wrexham | 20 |
| 7 | A | St Davids to Haverfordwest | 25 |
| 7 | B | Haverfordwest to St Davids | 25 |
| 8 | A | Ystrad Mynach to Crosskeys | 12 |
| 8 | B | Crosskeys to Ystrad Mynach | 12 |
| 9 | A | Sketty to Morriston | 9 |
| 9 | B | Morriston to Sketty | 9 |
| 10 | A | Pontypool to Blaenavon | 11 |
| 10 | B | Blaenavon to Pontypool | 11 |
| 11 | A | Bangor-on-Dee to Wrexham Maelor Hospital | 10 |
| 11 | B | Wrexham Maelor Hospital to Bangor-on-Dee | 10 |
| 12 | A | Barry Hospital to Dinas Powys | 8 |
| 12 | B | Dinas Powys to Barry Hospital | 8 |
| 13 | A | St Asaph to Denbigh | 9 |
| 13 | B | Denbigh to St Asaph | 9 |
| 14 | A | Treforest to Nantgarw | 7 |
| 14 | B | Nantgarw to Treforest | 7 |
| 15 | A | Coedpoeth to Wrexham Maelor Hospital | 5 |
| 15 | B | Wrexham Maelor Hospital to Coedpoeth | 5 |
Changes in journey times relative to 2023 (pre-implementation)
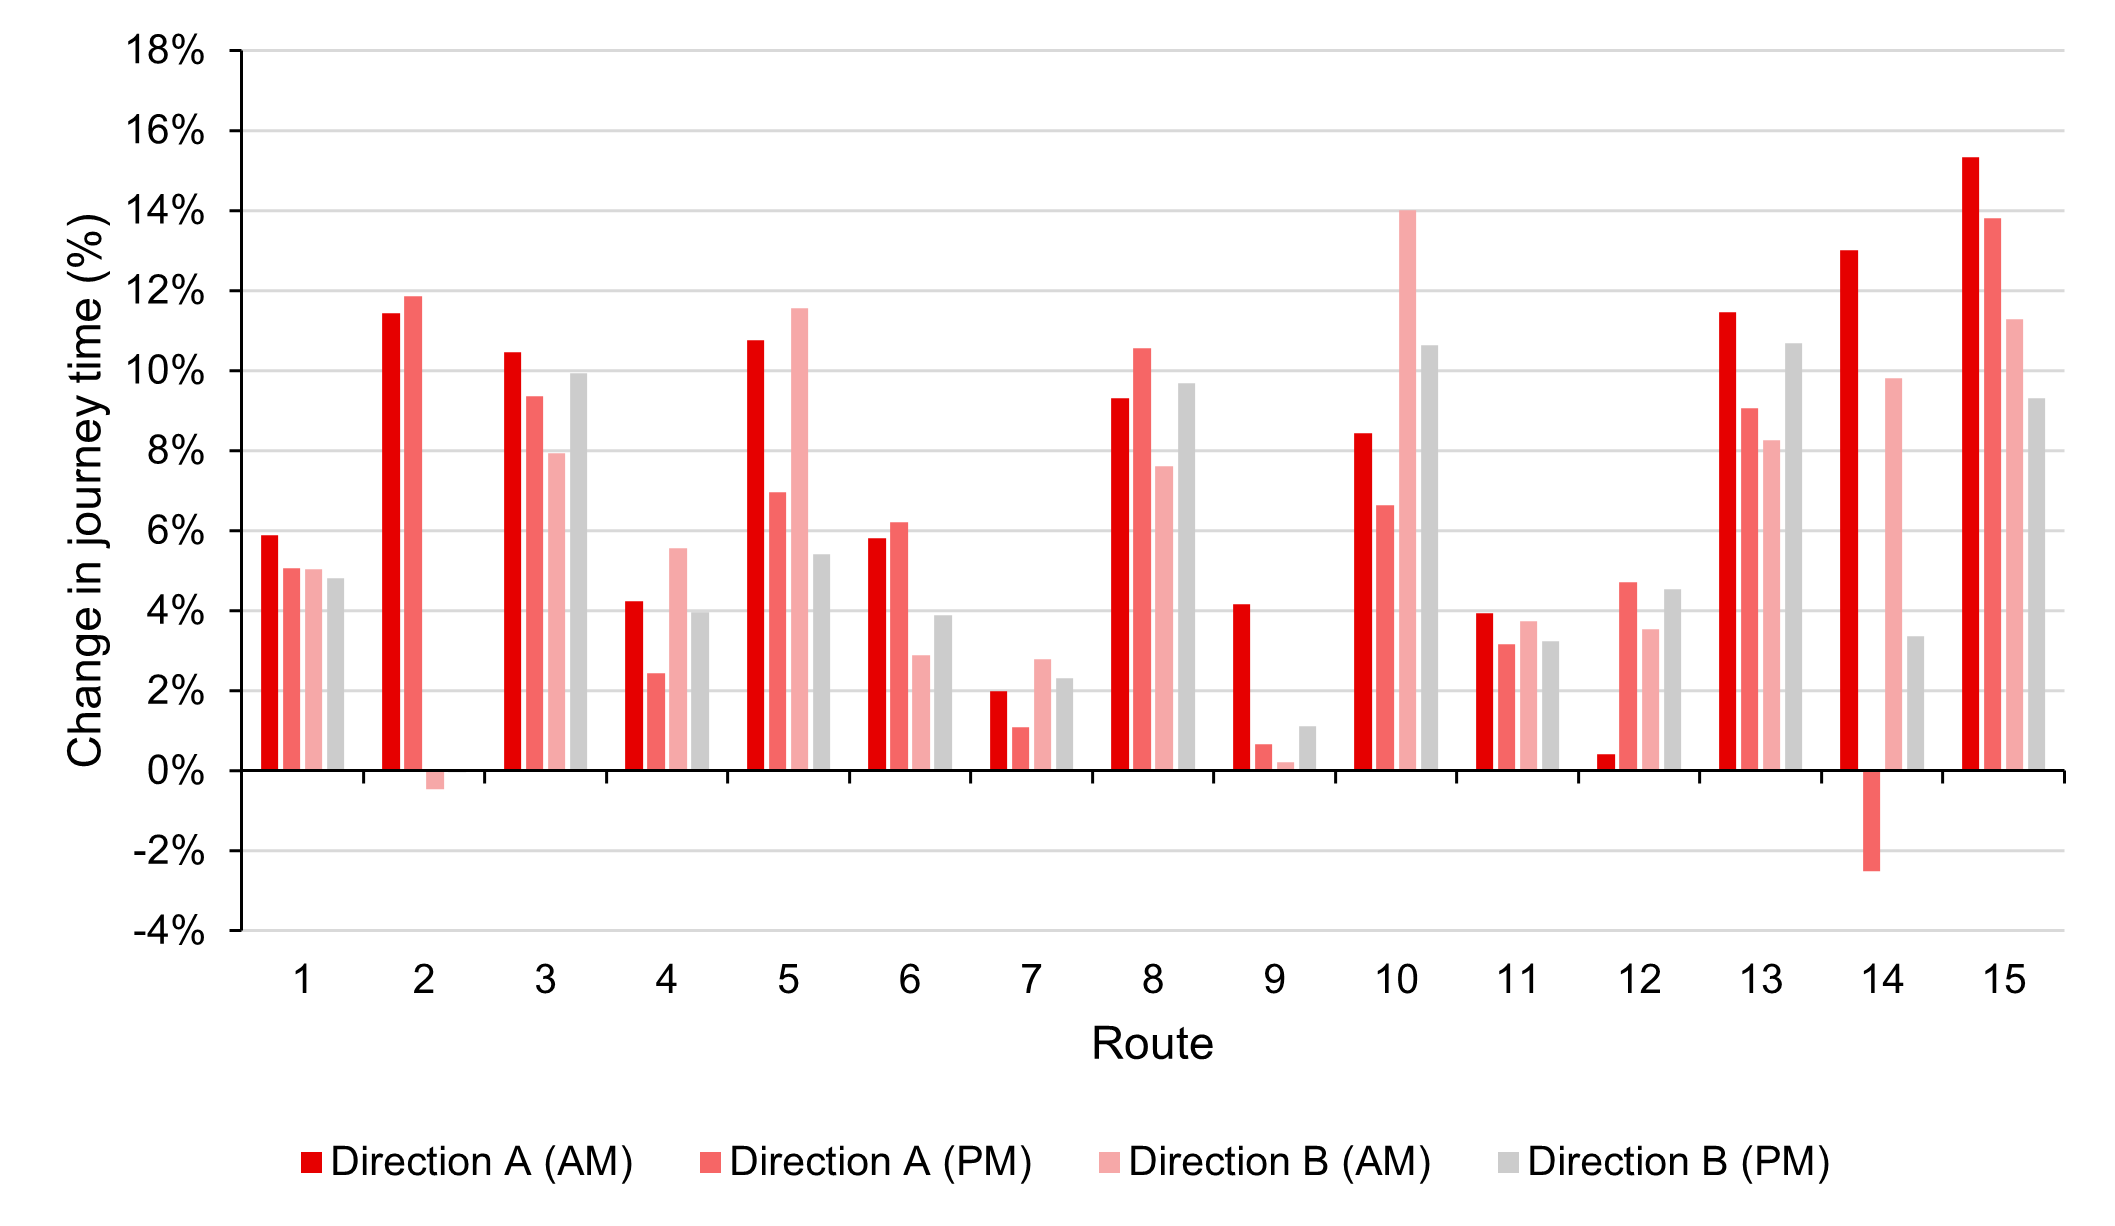
Figure 9 presents the average journey times for the latest period (autumn 2024). Figures 10 and 11 show the absolute and relative change in journey times for the latest period (autumn 2024) compared to the pre-implementation period (spring 2023). Key findings include that:
- In most cases (57 out of 60), average journey times have increased from spring 2023 (pre-implementation) to autumn 2024. The increase in all 57 of these of these is less than four minutes.²⁰ In the large majority of cases (44 out of 57), the increase is less than two minutes.
- The largest increase in average journey time was just under four minutes - on the Aberystwyth to Cardigan route (route number 1) in the morning peak period. However, this is only a 5.9% increase in overall journey time, reflecting the fact this route is considerably longer than the others at 61km.
- The largest percentage change was a 15.4% increase on the Coedpoeth to Wrexham Maelor route (route number 15A) in the morning period.
Figure 9: Autumn 2024 average journey times by route²¹
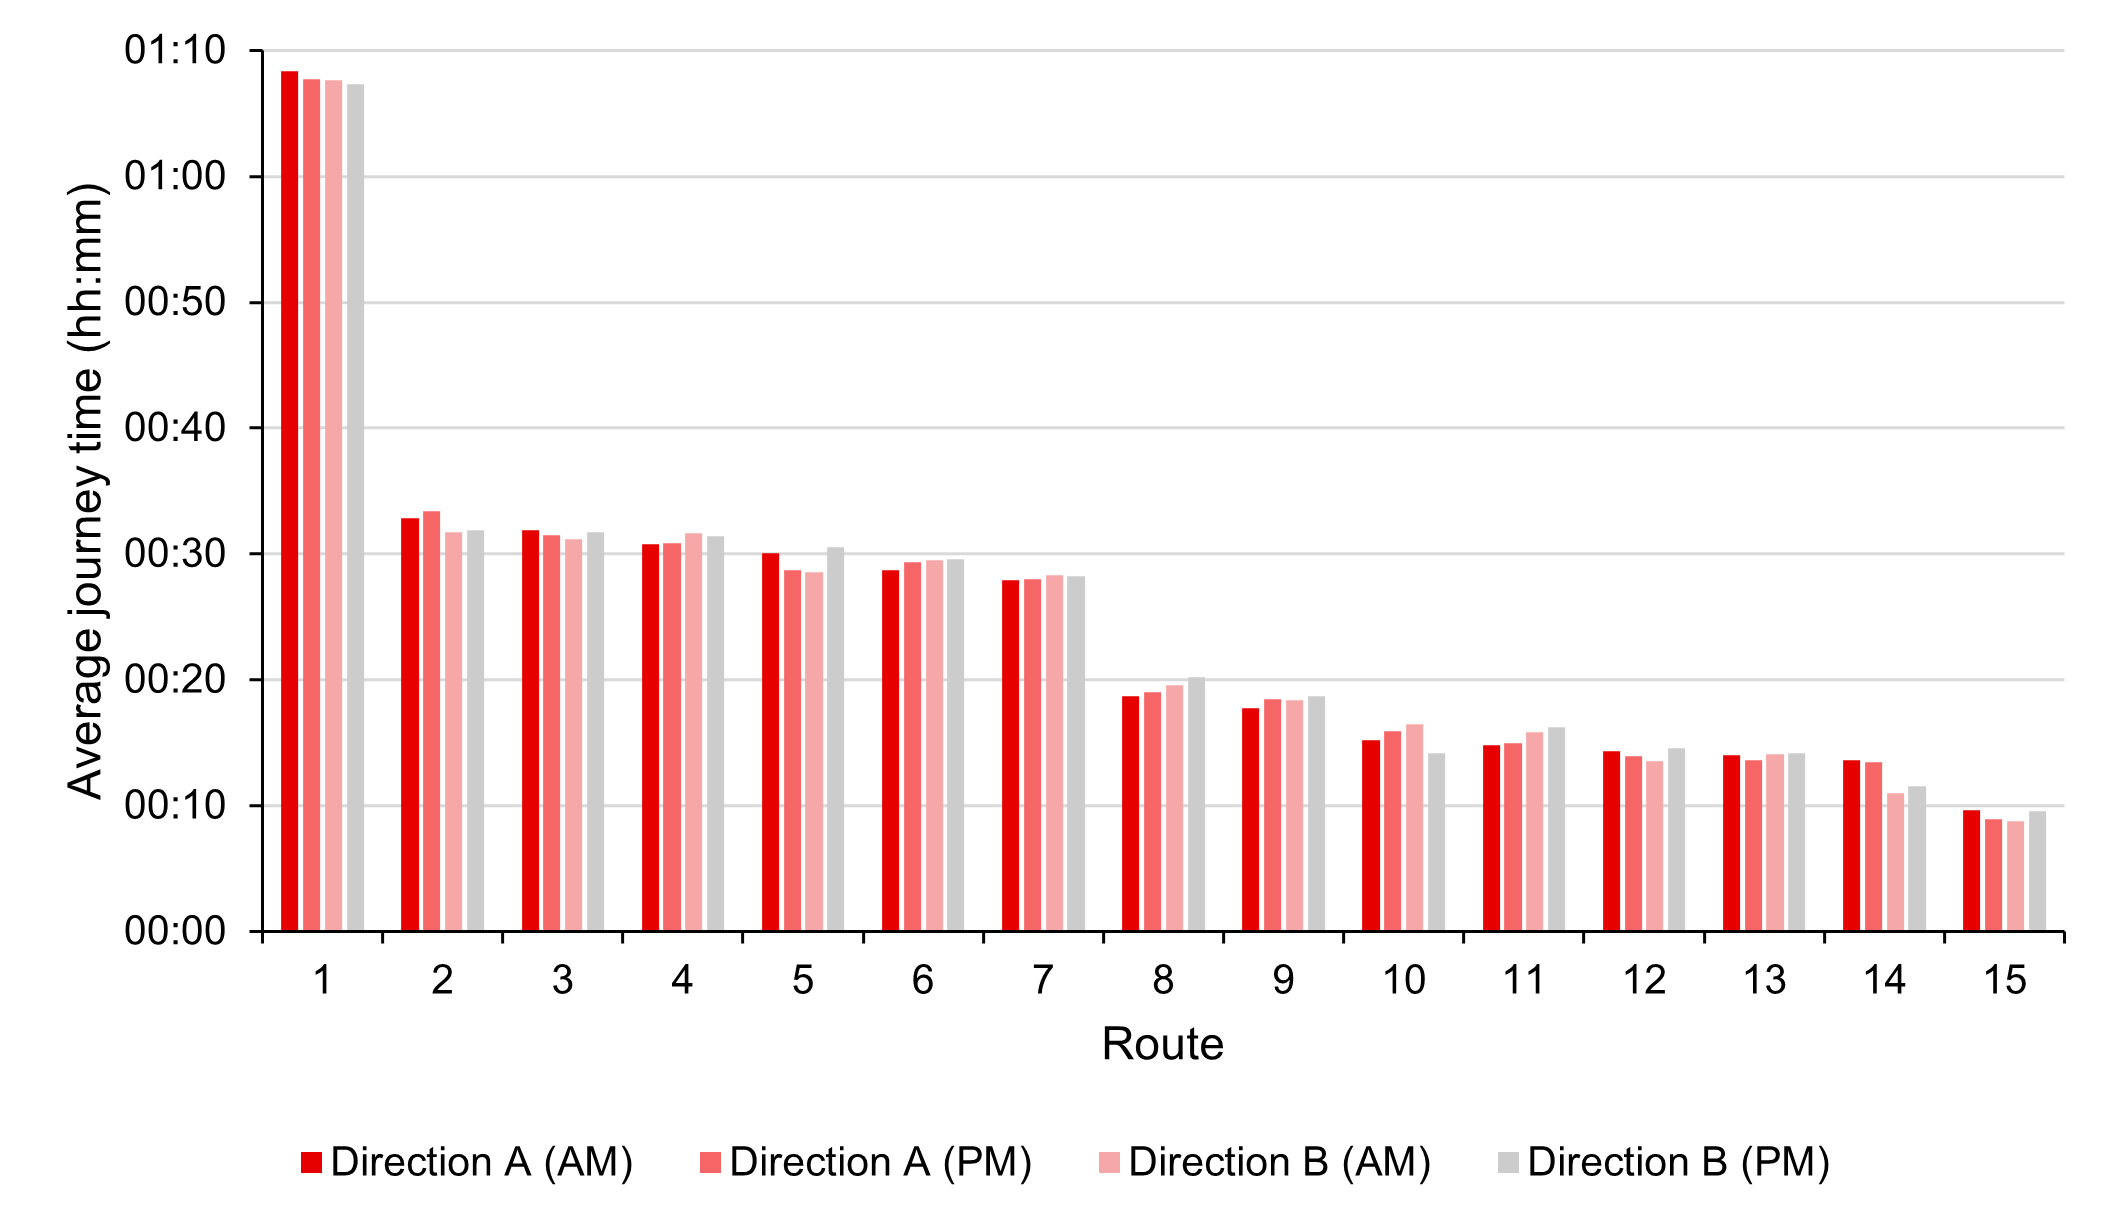
²⁰ Average journey times calculated for each of the 15 routes, for each direction and each peak period (AM and PM), so there are 60 average journey times presented in total.
²¹ Refer to table 7 for the names of routes numbered 1-15 on the x axis. Annex B (provided as a separate document on the TfW website) contains a map showing the route locations.
Figure 10: Change in average journey times, spring 2023 to autumn 2024
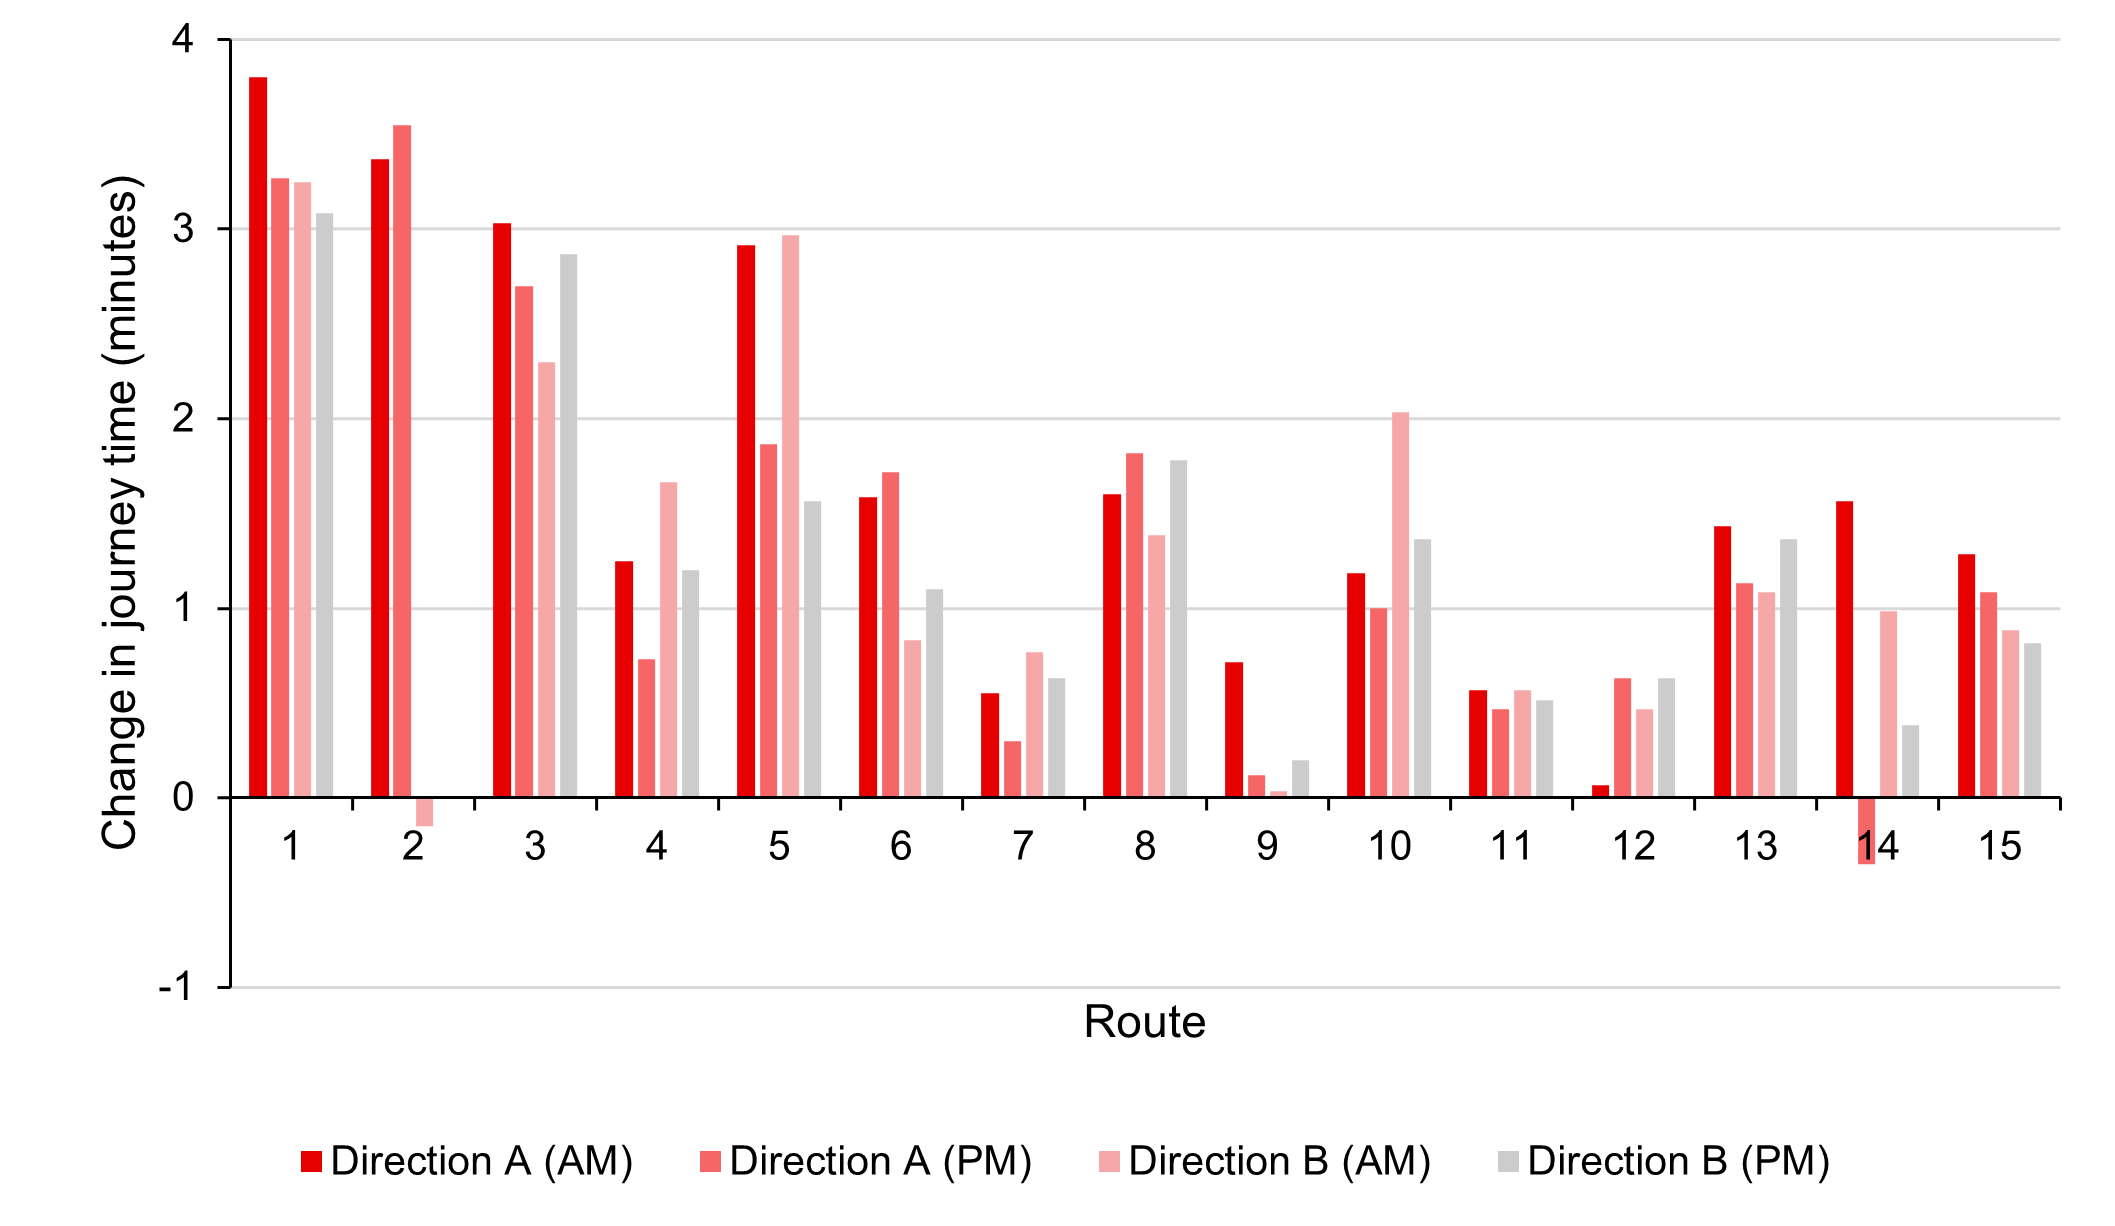
Figure 11: Percentage change in average journey times, spring 2023 to autumn 2024
Changes in journey times during 2024
Comparing the most recent period (autumn 2024) with the first period after implementation (spring 2024), journey times increased slightly during the year, but in most cases by less than one minute.
- The largest absolute increase was two minutes and 12 seconds on the Llandudno to Betws-y-Coed (2A) route in the afternoon
- The largest relative increase was 8.5%, observed on the Coedpoeth to Wrexham Maelor Hospital (15A) route in the morning.
Changes in journey time reliability
Journey time reliability is a measure of the extent to which variations in journey time are predictable for the person travelling. Unpredictable journey times usually reflect traffic congestion. Unpredictable or unreliable journey times mean that the same journey at the same time, but on different days, can take different lengths of time to complete.
Journey time variability has been included as part of KPI 1.4 in the national monitoring framework to assess whether the new default speed limit on restricted roads has led to any change in journey time reliability. For this KPI, reliability has been defined as the journey time range on a given route between the fastest 5% (the 5th percentile) and the slowest 5% (the 95th percentile) of all journeys.
Average journey time reliability has been calculated for each of the 15 routes, for each direction and each peak period (AM and PM), so there are 60 journey time variability results presented in total.
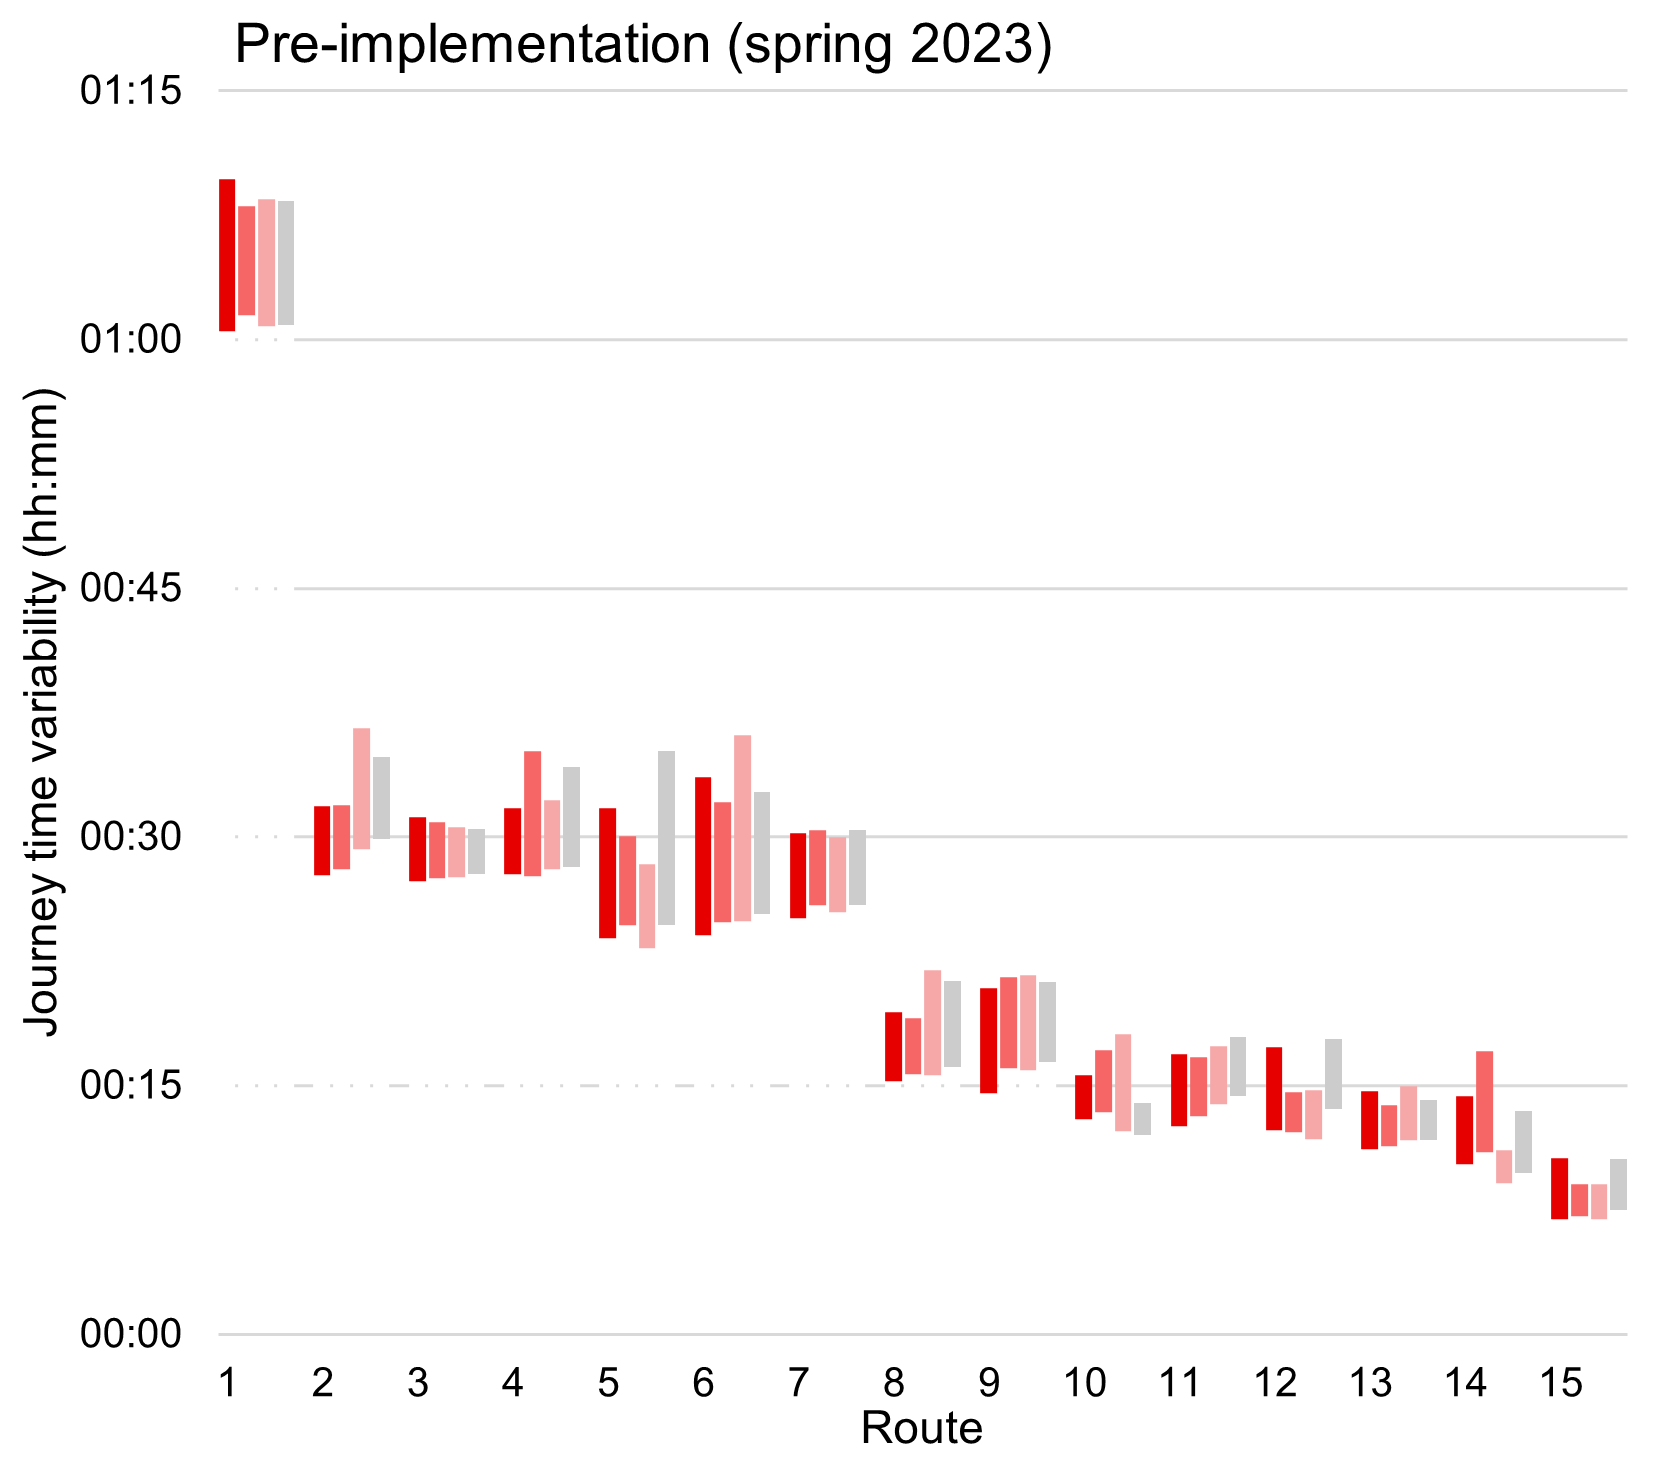
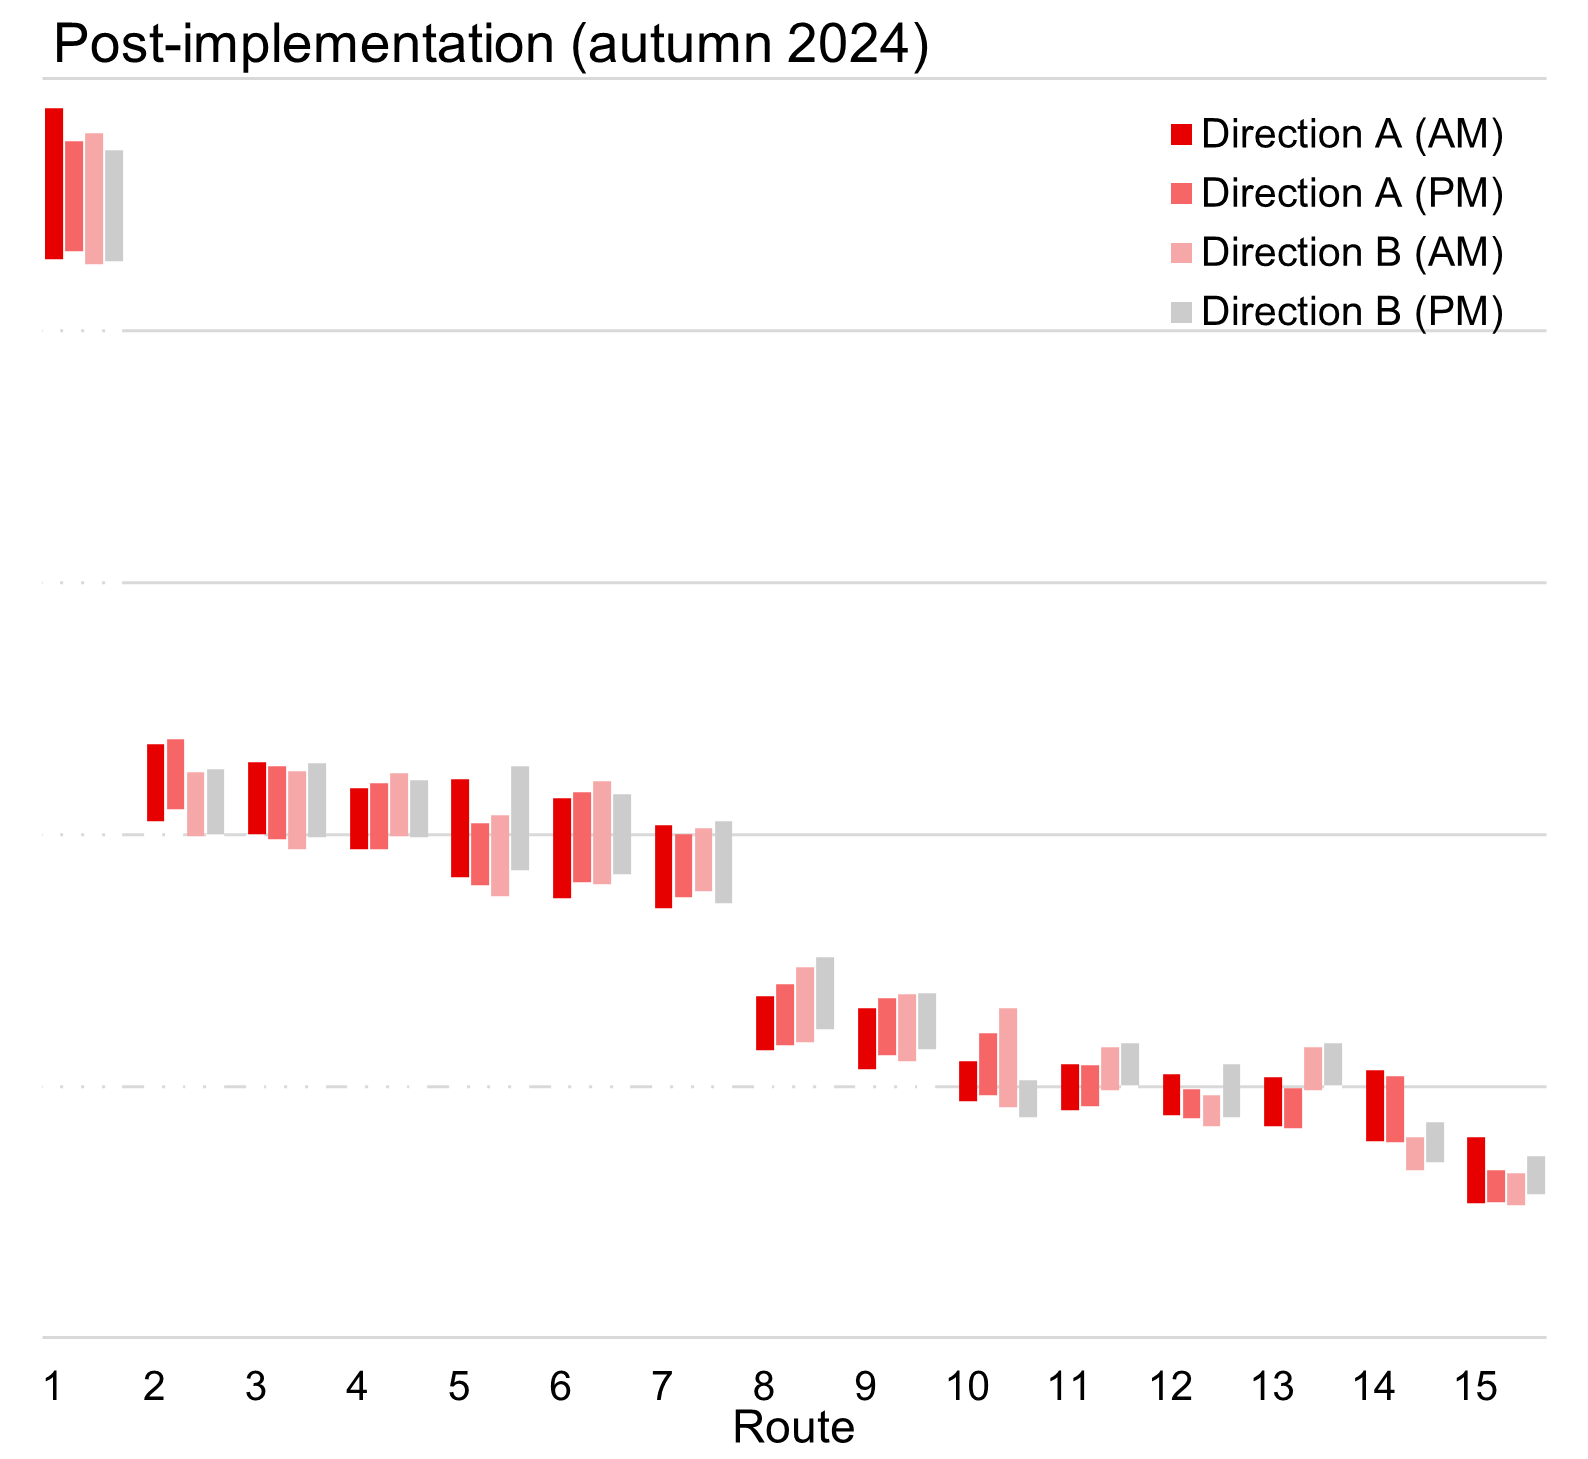
Figure 12 shows the average journey time variability for the pre-implementation period (spring 2023) on the left and the most recent post-implementation period (autumn 2024) on the right. The bottom of each bar represents the 5th percentile journey time and the top represents the 95th percentile journey time. The length of each bar therefore represents the variability of journey times for that route.
In many cases the whole bar has moved up, indicating a slight increase in the average journey time. At the same time, the length of the bar has decreased, meaning less journey time variability. This means that on most routes the journey times are slightly longer but are more reliable, so it is easier to predict how long the journey will take.
Overall, journey time variability has fallen and therefore journey time reliability has improved. Between spring 2023 and autumn 2024:
- In three-quarters of cases (45 of 60), journey time variability decreased.²²
- In just under half of the cases (29 out of 60), journey time variability decreased by more than 20%.
- In a quarter of cases (15 of 60), journey time variability increased, but in only two cases did it increase by more than one minute. Both were on the Coleg Sir Gar to Carmarthen route (3B), which saw the largest variability increase of +1:42 minute (63.0%) in the afternoon.
²² Average journey time reliability calculated for each of the 15 routes, for each direction and each peak period (AM and PM), so there are 60 calculations in total.
Figure 12: Average journey time variability by bi-directional route and time period (AM and PM)²³
²³ See table 7 for the names of the routes numbered 1-15 on the x axis. A map showing route locations is included in Annex B, provided as a separate document on the TfW website.
Figures 13 and 14 show the changes in average journey time variability in absolute terms (minutes) and relative terms (percentages).²⁴
Figure 13: Absolute change in journey time variability, spring 2023 to autumn 2024
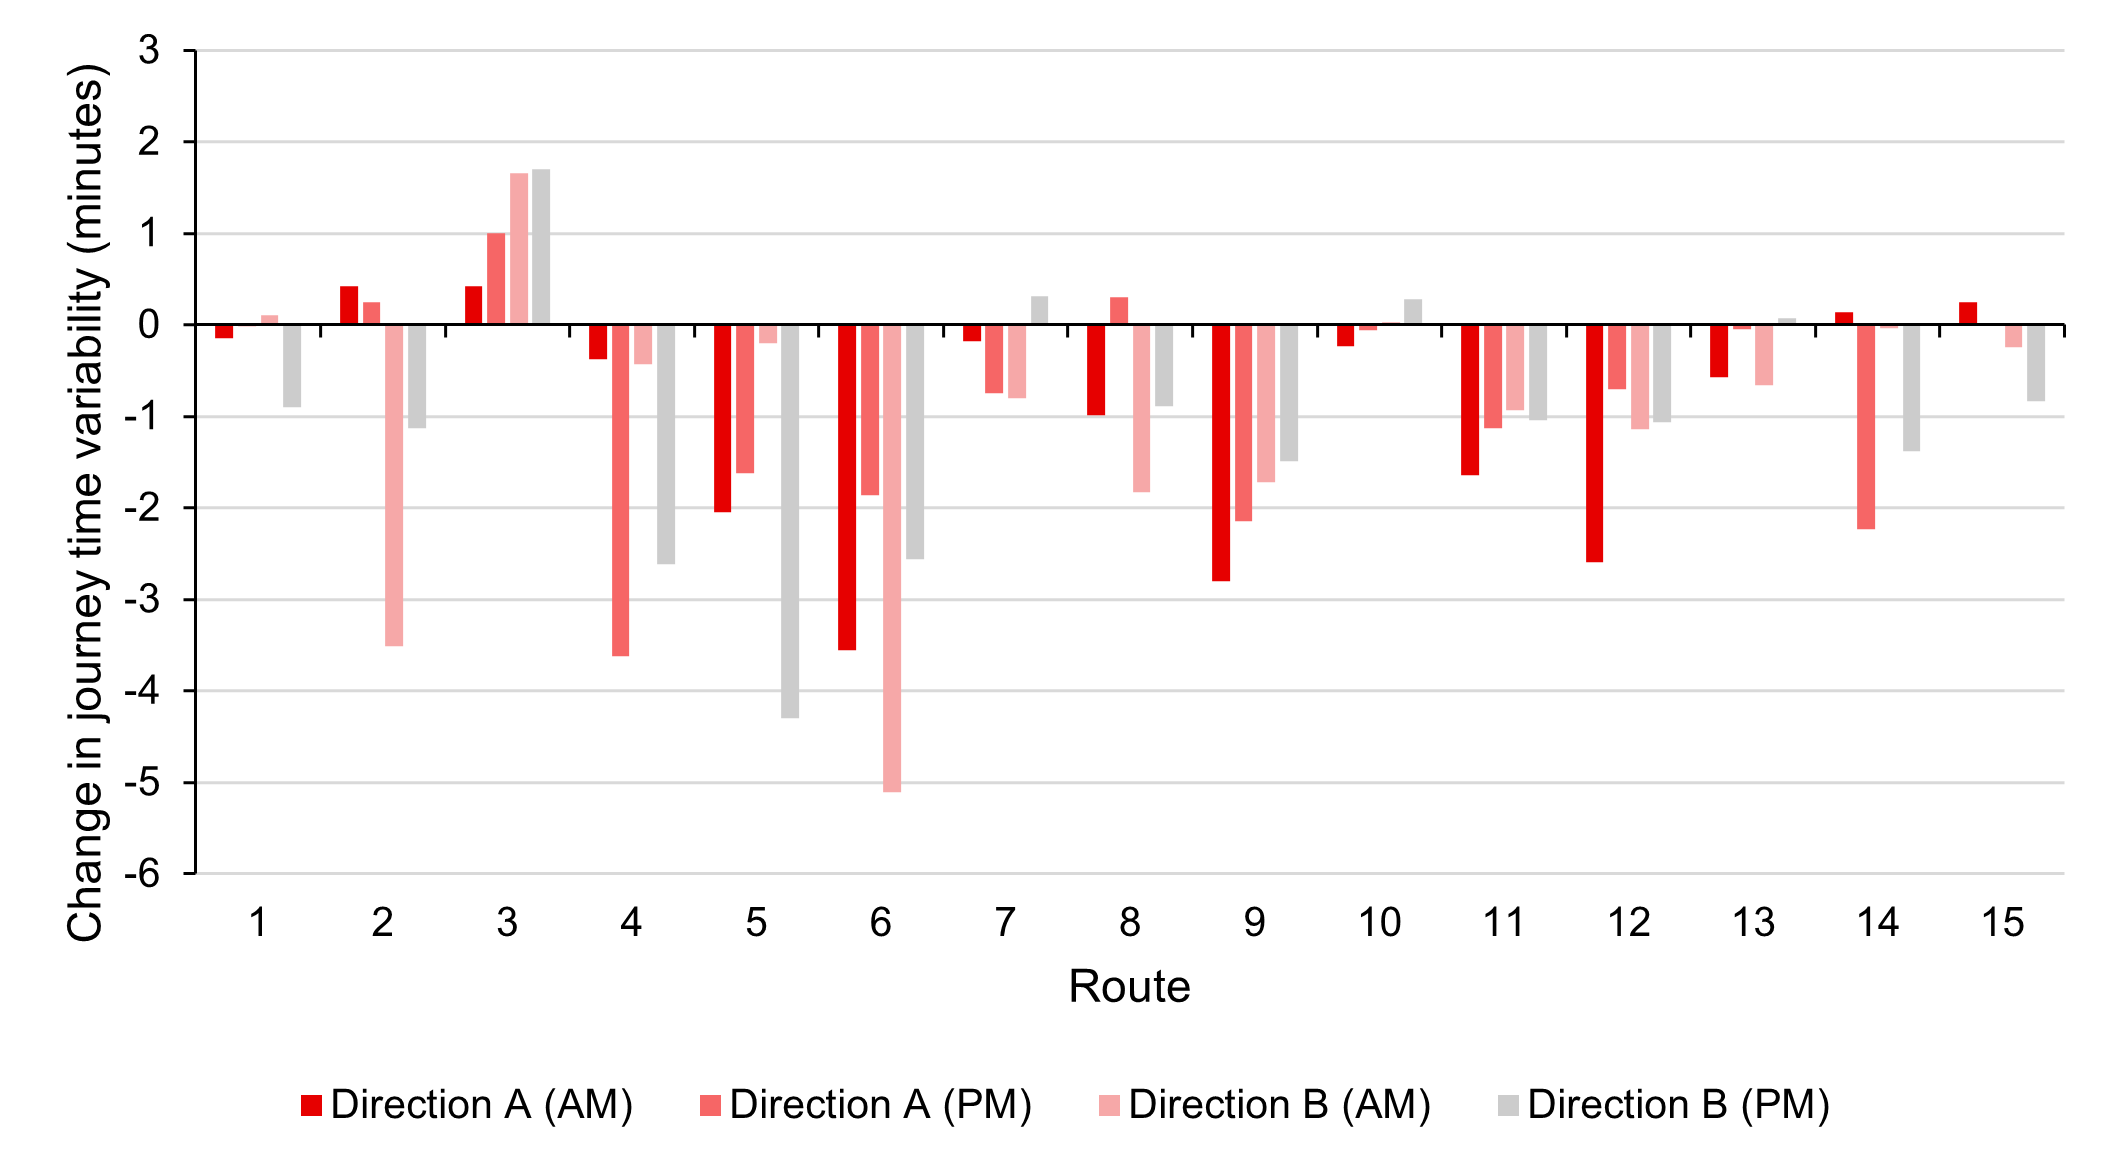
Figure 14: Relative change in journey time variability, spring 2023 to autumn 2024
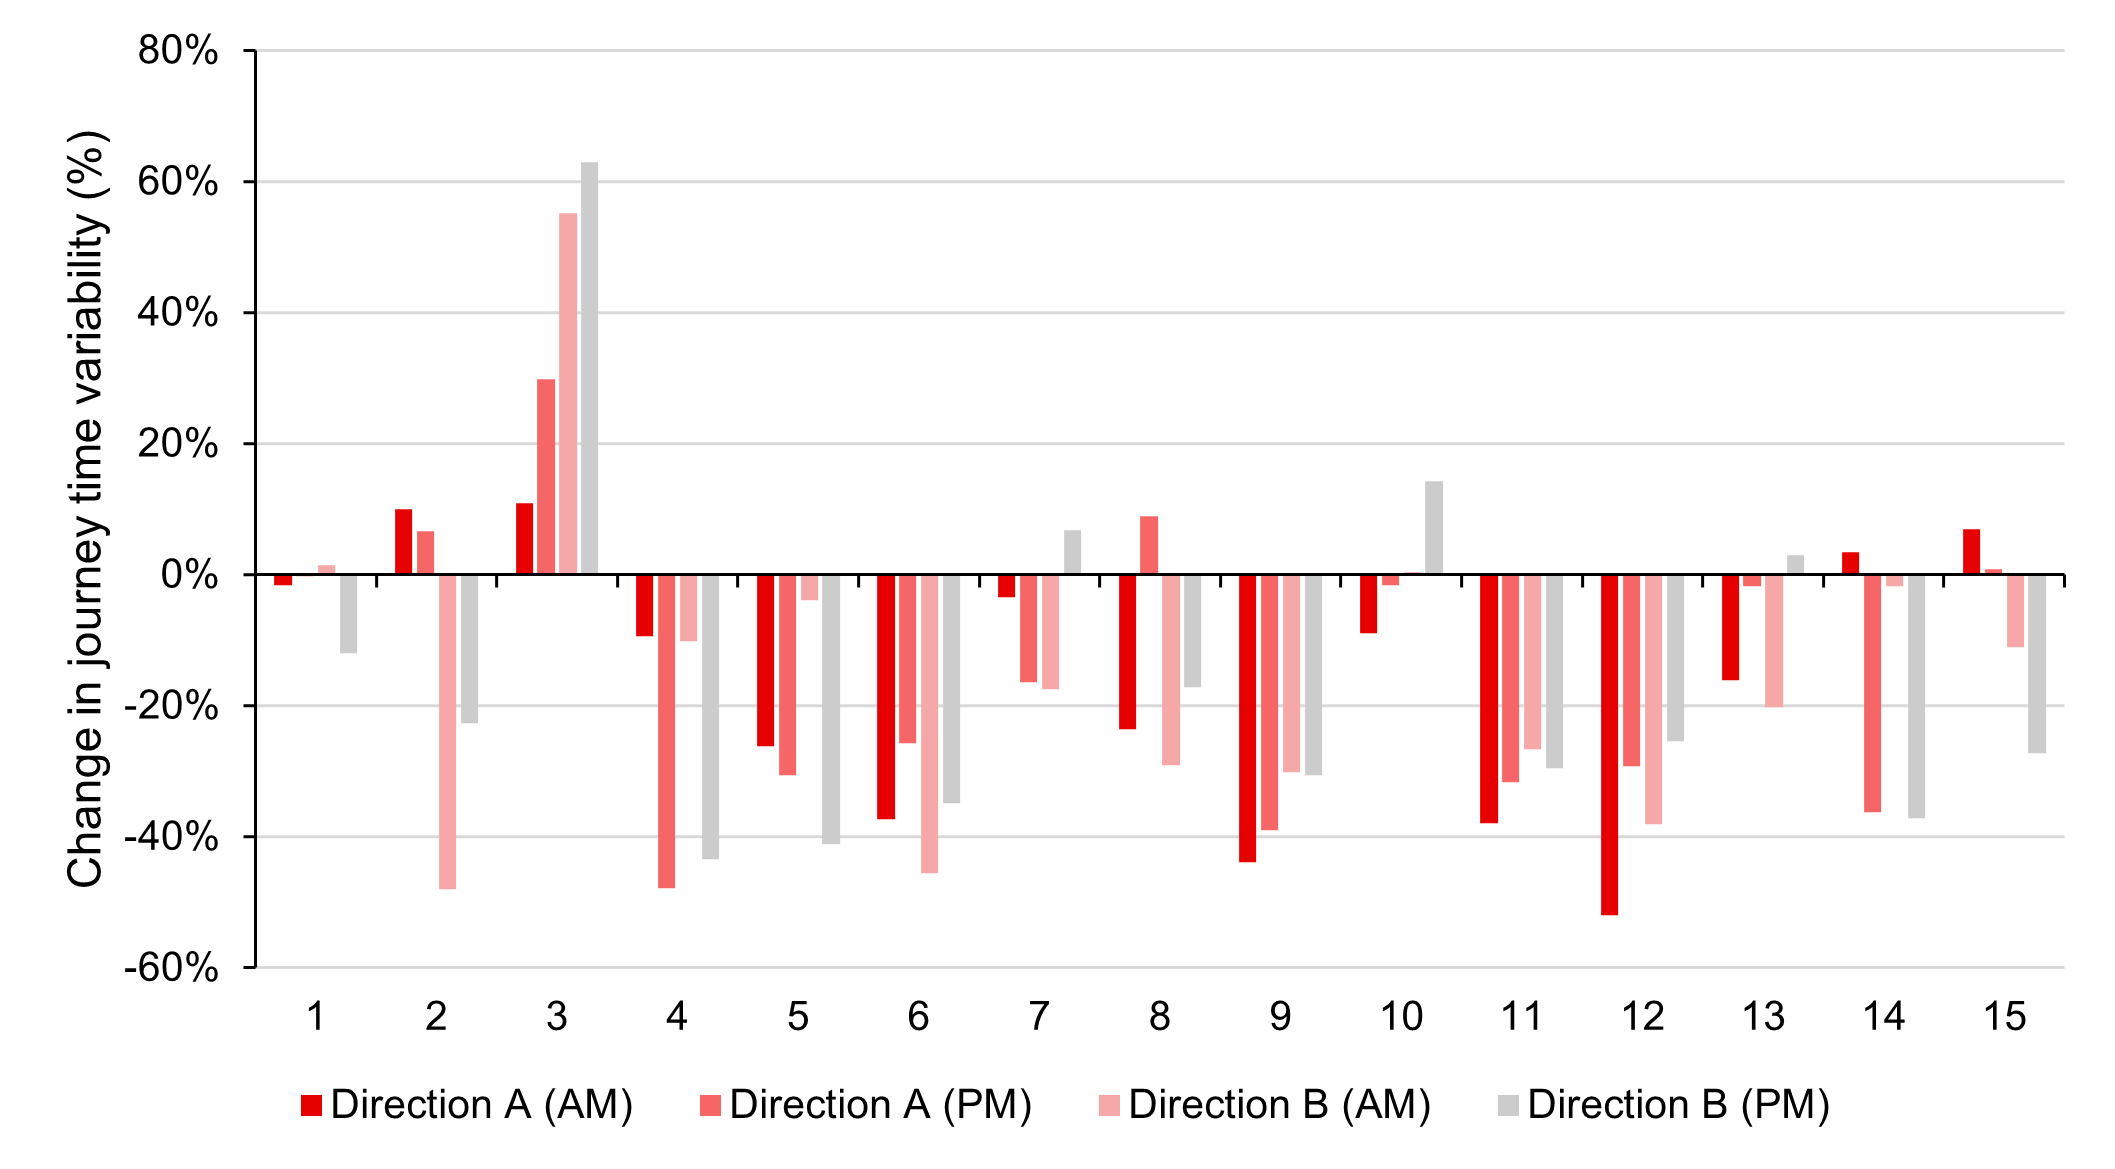
²⁴ See table 7 for the names of routes numbered 1-15 on the x axis. Route locations are shown in Annex B (provided as a separate document on the TfW website).
3.3. Changes in attitudes to active travel use in built-up areas
Headline assessment
There is no new data available to track the KPI on attitudes to active travel. However, the results from the phase 1 research in 2022 are included here for reference.
Table 8: Active travel KPI assessment
| KPI | KPI description | Assessment (November 2022) |
| 3.1 | Change in attitude to active travel use in built-up areas | 25 percentage point increase in active travel use on journeys to school in phase 1 20mph areas, compared to an 18 percentage point increase in 30mph control locations |
This research²⁵ , conducted by Living Streets for the Welsh Government, assessed travel behaviours and attitudes towards active travel (walking, wheeling and cycling). Surveys were carried out with 3,036 children in two groups of primary schools located within:
- Phase 1 areas, where the speed limit had been brought down to 20mph
- Separate control areas, where the limit remained at 30mph.
Baseline surveys in the first part of the 2021/22 academic year indicated that 49% of children across the phase 1 and control areas either walked or cycled to school.
Surveys conducted later in the same academic year showed that active travel had increased among children in both the phase 1 and control area schools.
However, in schools in the phase 1 areas, the increase was from 49% to 74% (a 25 percentage point increase), compared to an increase from 49% to 67% (an 18 percentage point increase) in the control areas.
²⁵ Wales 20mph pilot support: end-of-project-report-20mph.pdf
3.4. Vehicle and pedestrian interactions
Headline assessment
Table 9 presents the headline KPI assessment for vehicle and pedestrian interactions based on data collected in three areas before and after implementation of the 20mph speed limit.
Table 9: Vehicle and pedestrian interaction KPI assessment
| KPI | KPI description | Assessment |
| 3.2 | Change in vehicle and pedestrian yielding behaviours | The results are inconclusive at this stage as the change in yielding behaviours varied between the sites assessed. |
Locations and method
Transport for Wales commissioned VivaCity to monitor vehicle and pedestrian interactions using specialised cameras, assessing how drivers react to pedestrians who are intending to cross or who are already crossing the road.
Data has been analysed for a pre-implementation period, when the speed limit was 30 mph (28 February - 31 March 2023) and two post implementation periods, when the speed limit was 20 mph (19 February - 18 March 2024 and 1 - 28 February 2025). This was undertaken at three pedestrian crossings:
- Gilwern, Crickhowell Road (Site 1)
- Queensferry, Station Road (Site 2)
- Cardiff Thornhill, Excalibur Drive zebra crossing (Site 3).
Software linked to the cameras assigned interactions between vehicles and pedestrians to one of five separate categories:
- Vehicle slowed or stopped, to allow a pedestrian to cross
- Vehicle maintained speed, with pedestrian waiting at the crossing
- Vehicle maintained speed, with pedestrian already crossing the road
- Vehicle sped up, despite pedestrian waiting at the crossing
- Vehicle sped up, despite pedestrian already crossing the road.
Instances where vehicles ‘maintained speed with pedestrian already crossing’ does not necessarily indicate dangerous behaviour, as this would depend on the vehicle speed, distance from the crossing and the exact location of the pedestrian.
Monitoring results - vehicle and pedestrian interactions
The monitoring results are shown in table 10.
Table 10: Vehicle and pedestrian interactions, 2023 to 2025
| Vehicle and pedestrian interaction | Slowed or stopped | Maintained speed: Overall | Maintained speed: pedestrian waiting | Maintained speed: pedestrian in crossing | Sped up: Overall | Sped up: pedestrian waiting | Sped up: pedestrian in crossing |
Site 1: 2023 Site 1: 2024 Site 1: 2025 | 70.5% 73.7% 76.5% | 24.4% 18.0% 15.6% | 20.9% 13.2% 14.8% | 3.5% 4.8% 0.8% | 5.1% 8.4% 8.6% | 4.9% 7.5% 8.4% | 0.2% 0.9% 0.2% |
| Site 1: Percentage point change (2023 to 2025) | +6.0 | -8.8 | -6.1 | -2.7 | +3.5 | +3.5 | +0.1 |
Site 2: 2023 Site 2: 2024 Site 2: 2025 | 11.0% 8.9% 7.4% | 55.3% 56.1% 54.7% | 46.1% 48.9% 41.3% | 9.2% 7.3% 13.4% | 33.7% 35.0% 37.9% | 28.9% 32.4% 28.5% | 4.7% 2.6% 9.4% |
| Site 2: Percentage point change (2023 to 2025) | -3.6 | -0.6 | -4.8 | +4.2 | +4.2 | -0.4 | +4.6 |
Site 3: 2023 Site 3: 2024 Site 3: 2025 | 16.6% 15.0% 13.6% | 82.3% 83.8% 85.5% | 31.3% 32.9% 34.0% | 51.1% 50.9% 51.4% | 1.1% 1.3% 0.9% | 0.5% 0.6% 0.3% | 0.5% 0.6% 0.6% |
| Site 3: Percentage point change (2023 to 2025) | -3.0 | +3.1 | +2.8 | +0.4 | -0.1 | -0.2 | +0.1 |
Changes were small and not consistent across all sites (or between sites). For instance:
- There was a small increase between 2023 and 2025 in drivers who slowed or stopped at site 1, but a small decrease at sites 2 and 3.
- There was also a small increase in vehicles speeding up when approaching a crossing where a pedestrian was waiting at sites 1 and 2, but very little change at site 3.
This variation is also apparent in figure 15, with the same data presented as a chart.
Figure 15: Comparison of vehicle and pedestrian interactions, 2023 to 2025
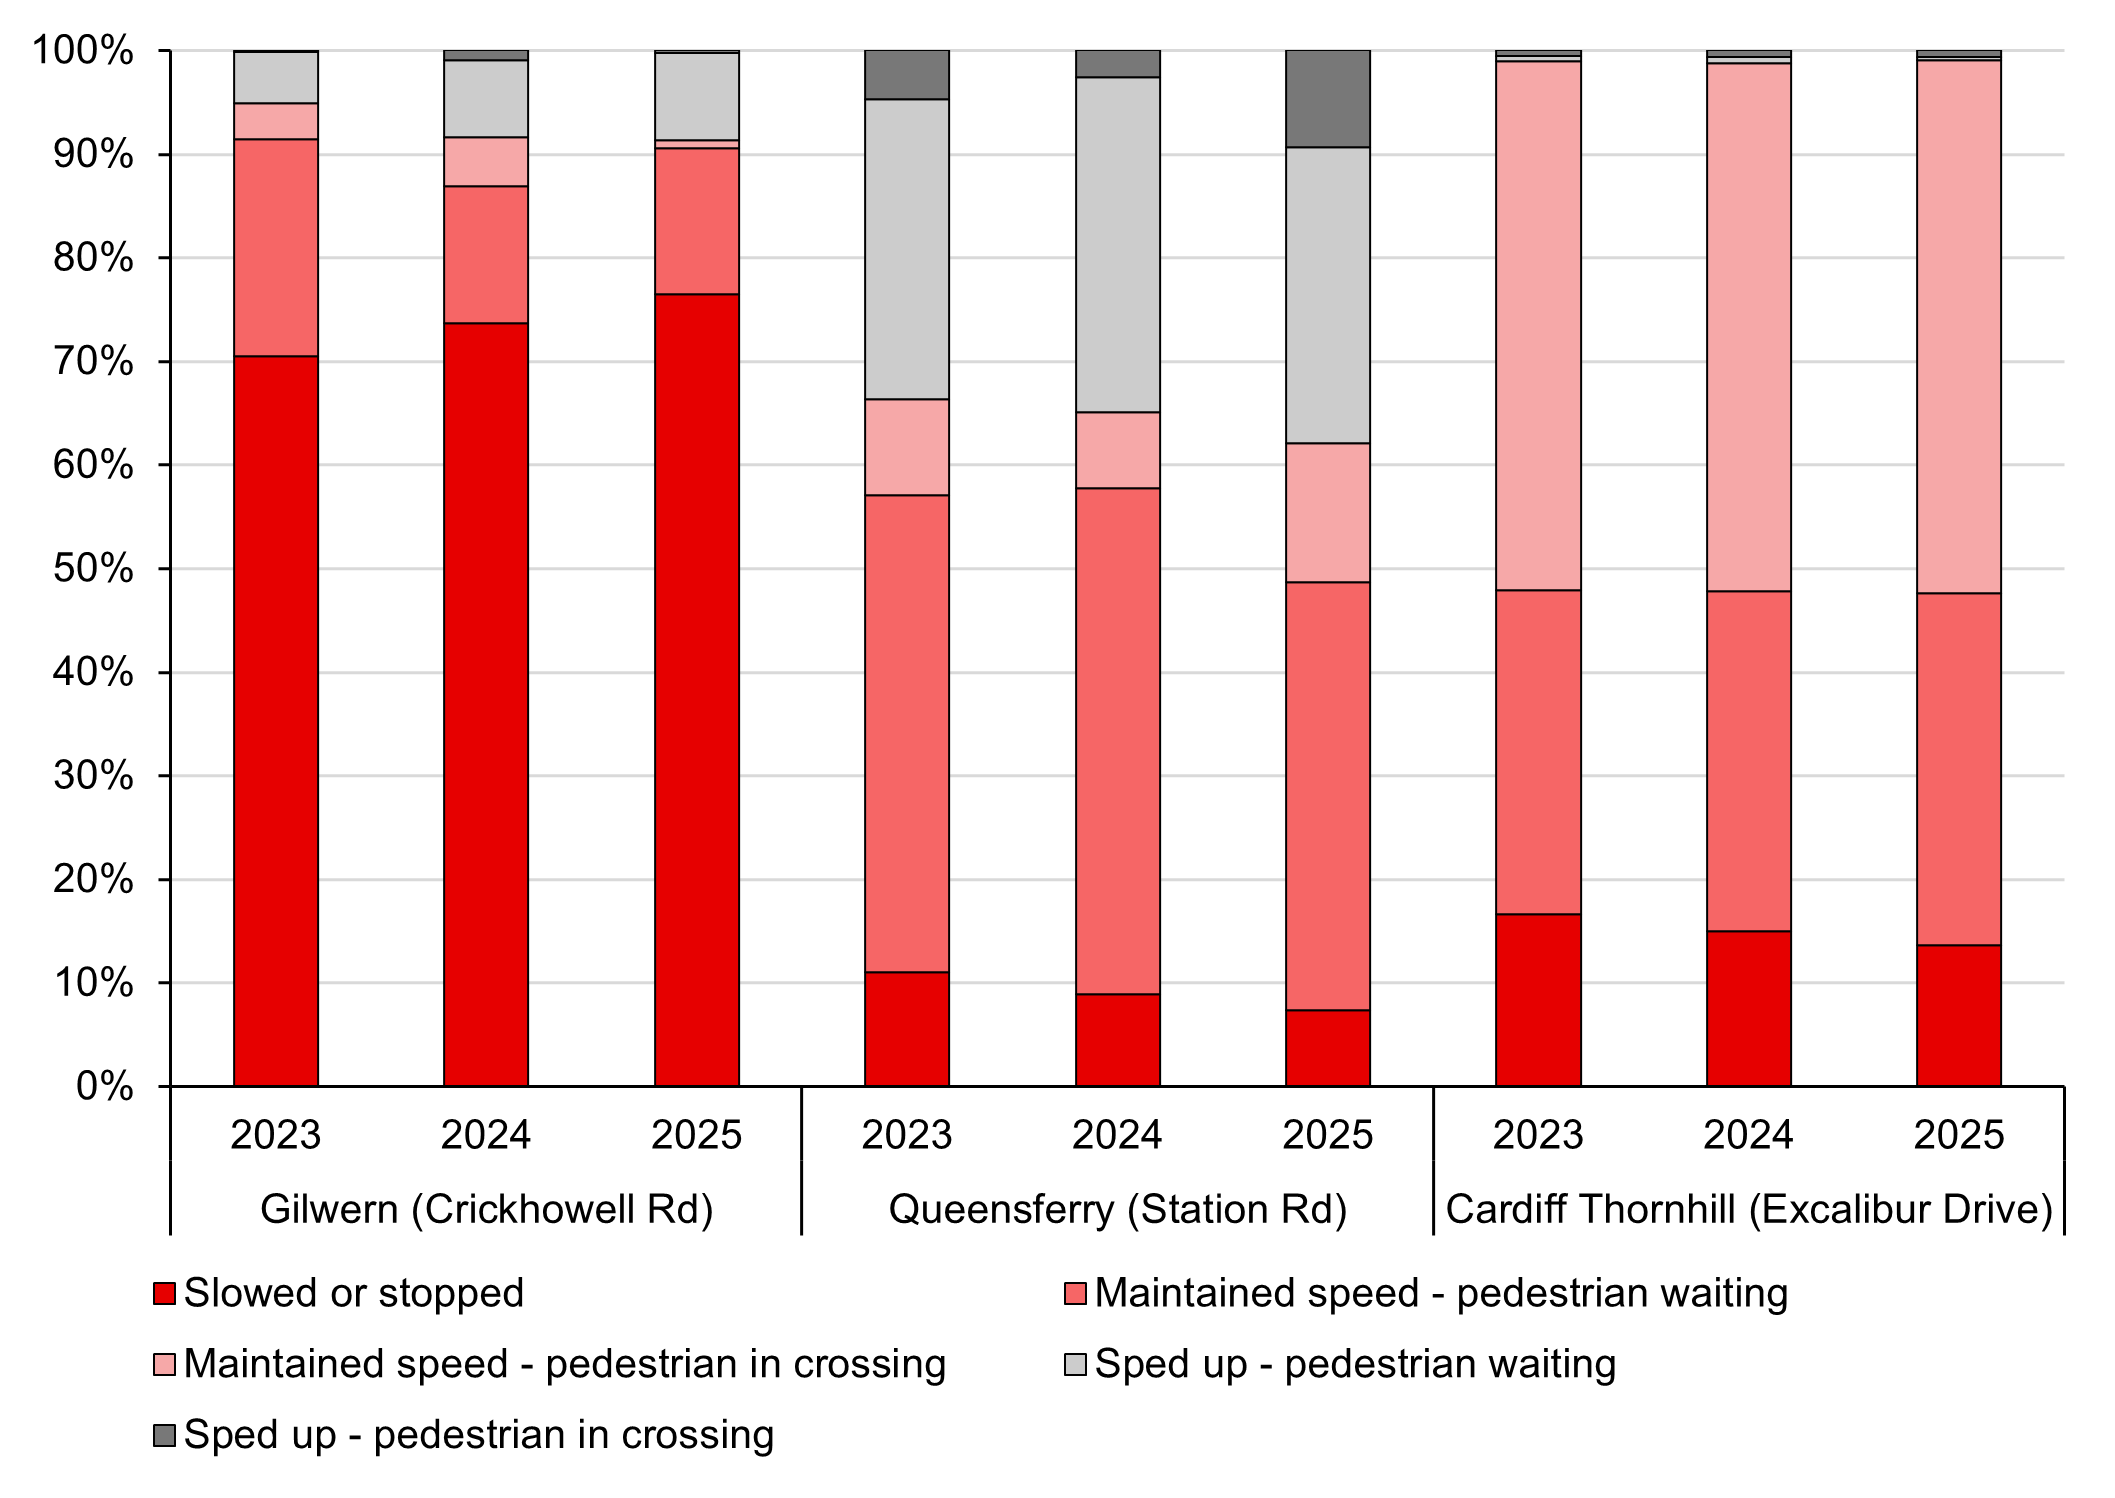
Overall, it is difficult to draw firm conclusions on the effect of the speed limit change on yielding behaviours from the data collected. It is notable that the three sites have different types of crossing and road layouts. These were at:
- Site 1 (Gilwern) - A double road crossing separated by an island at a T-junction.
- Site 2 (Queensferry) - A crossing build-out on a busy high street with shops and parked vehicles.
- Site 3 (Cardiff) - A zebra crossing outside a supermarket.
Driver behaviour varies significantly between these sites. For instance, before the speed limit change at the Gilwern site, over 70% of interactions involved a driver slowing or stopping at the crossing, whereas at the other two sites this was less than 20%. It is possible, therefore, that any effects from a reduced speed limit may vary between these different types of crossings and may be outweighed by other factors influencing driver behaviour.
3.5. Air quality
Headline assessment
Air quality data was collected continuously from May 2022 to April 2024 at three sites, where speed limits were reduced to 20mph in 2022 during phase 1. Plans are being prepared to obtain new air quality datasets from across Wales, with analysis to be included in later publications. For reference, this section summarises the phase 1 findings included in the previous report.
Table 11: Air quality KPI assessment, May 2022 - April 2024
| KPI | KPI decsription | Assessment |
| 4.1 | Change in local air quality - NO2, PM10 and PM2.5 | No materially significant effect |
Locations and method
Sensors were deployed in Cardiff, Severnside (Magor), and Abergavenny to monitor levels of nitrogen dioxide (NO2) and particulates (PM10 and PM2.5). Sensors were placed inside and outside the 20mph speed limit areas and calibrated against an accurate reference station in Bridgend. Traffic volumes and speeds were also monitored.
Monitoring results - air quality
Data collected from May 2022 to April 2024 showed minimal changes in PM10 and PM2.5 from road traffic emissions. However, there were changes in average levels of NO2 inside and outside each of the 20mph speed limit areas, as presented in table 12.
Table 12: Average NO2 concentrations recorded between May 2022 and April 2024
| Area | Inside 20mph area (µg/m3) | Outside 20mph area (µg/m3) | Difference inside 20mph area (µg/m3) | Measurement Error (µg/m3) |
| Cardiff (location 1) | 21.0 | 20.6 | +0.4 | 3.6 - 3.8 |
| Cardiff (location 2)²⁶ | 21.7 | 23.3 | -1.6 | 1.4 - 4.3 |
| Magor (Severnside) | 20.2 | 25.8 | -5.6 | 2.6 - 5.1 |
| Abergavenny | 15.0 | 14.5 | +0.5 | 1.6 - 2.7 |
The same data is presented below in chart format in figure 16.
²⁶ The sensor outside the 20mph area in Cardiff had to be relocated from ‘location 1’ to ‘location 2’ due to roadworks part way through the assessment period.
Figure 16: Summary of NO2 concentration data within each area
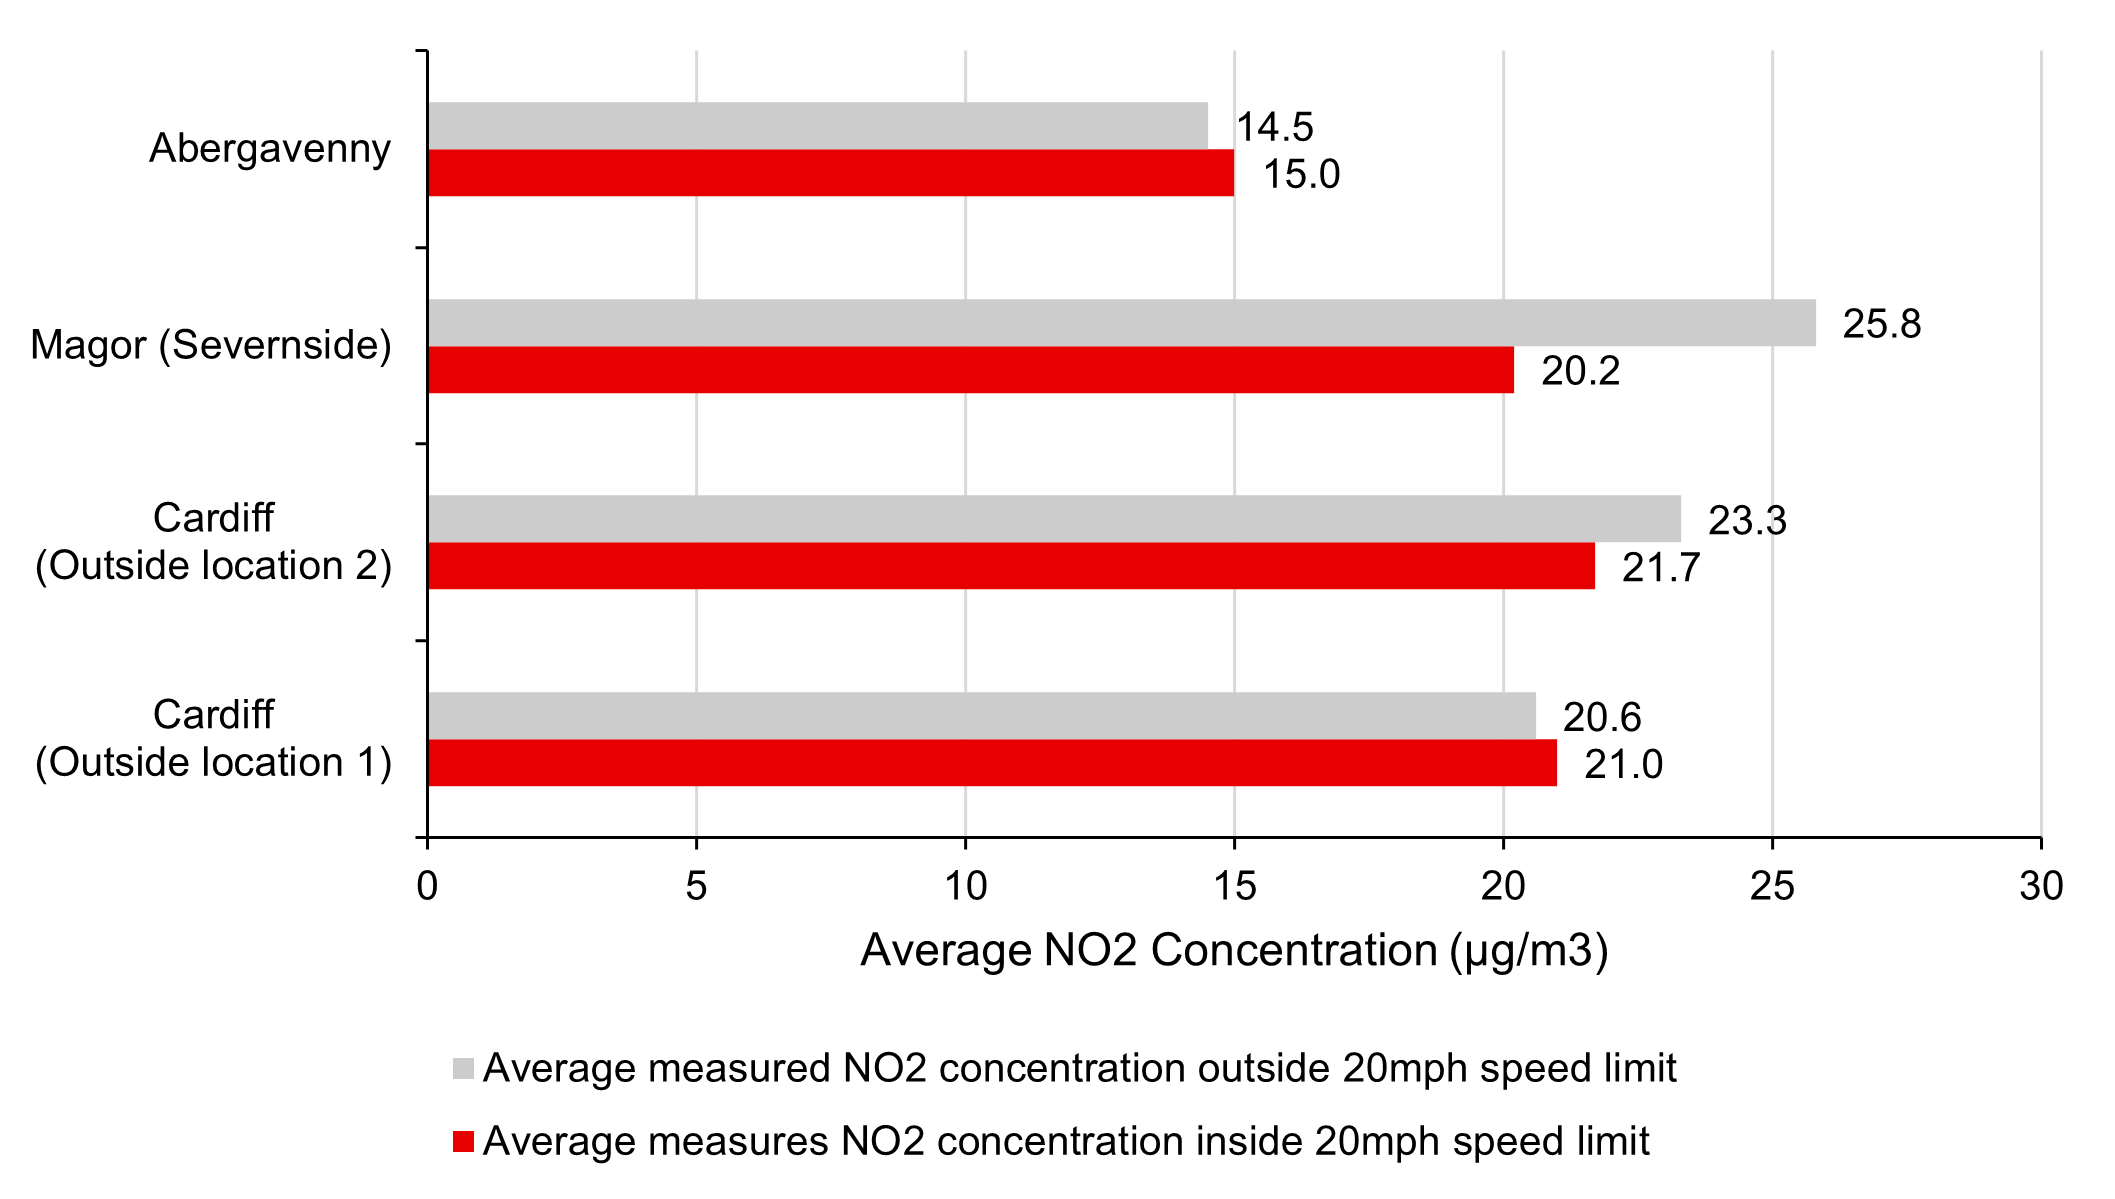
At all locations, small differences in NO2 concentrations were observed inside the 20mph speed limit area compared to outside. In Cardiff (using outside location 2) and Magor, NO2 levels were lower inside the 20mph speed limit area. In Cardiff (using outside location 1) and Abergavenny, NO2 levels were slightly higher inside the 20mph speed limit area, but well within the margin of measurement error.
Other than at Magor, the differences were minor and within the margin of error. As a result, it is not possible to say that there was a materially significant effect resulting from the 20mph speed limit.
Variations in air quality can also be influenced by other site-specific factors that affect traffic volumes or vehicle acceleration. These could have a greater influence on traffic emissions than slight changes in vehicle speed. These factors include nearby construction works and associated traffic management measures, nearby temporary road closures and proximity to vegetation. These factors are explained in detail in the phase 1 Air Quality Monitoring Report.²⁷
²⁷ Published in May 2024 at https://tfw.wales/about-us/transparency/publications/default-20mph-speed-limit/may-2024
3.6. Casualties
Headline assessment
It is currently too early to report on whether there has been a reduction in the number of pedestrians and cyclists killed or seriously injured on the road network (KPIs 2.1, 2.2 and 2.3). It is advisable to use at least three years’ worth of collision data post implementation to allow for meaningful comparisons with at least a three-year pre implementation period.²⁸
Trends in the total number of casualties for all road users (including drivers, cyclists and pedestrians) are discussed below to provide a preliminary indication of the policy’s effectiveness in improving road safety. Welsh Government data for road casualties is presented by speed limit and severity, split into two categories: killed or seriously injured (KSI) and slightly injured.²⁹ However, it does not separate casualties into drivers, pedestrians, cyclists or age groups.
Table 13: Road casualties summary data
| Casualties objective | Assessment |
Reduce the number of pedestrians and cyclists killed or seriously injured on the road network.
| In the first 12 months after the introduction of the default 20mph speed limit, there was a 11.8% decrease in total casualties. Casualties on 20 and 30mph roads decreased by 26.2% while casualties on >40mph roads increased by 4.2%. Lack of sufficient data at this stage to be able to assess trends in pedestrian and cyclist casualties. |
Locations and method
Police forces compile data on road traffic accidents and casualties for the Welsh Government and Department for Transport. Casualties are classified as killed, seriously injured, or slightly injured. Fatalities are defined as deaths occurring within 30 days of the accident.
Most Welsh police forces continue to use a non-injury-based system, where officers judge the level of severity. However, in May 2023, Dyfed-Powys police force adopted the injury-based Collision Recording and Sharing (CRaSH) system, which is likely to increase the proportion of 'serious' injuries by 5-15% and decrease 'slight' injuries (without affecting the total number of casualties). From Q2 2023, more collisions in Dyfed-Powys are expected to have been reported as serious, slightly increasing the same trend in the overall figures for Wales.
²⁸ RoSPA (2002) Road Safety Engineering Manual, RoSPA: London
²⁹ Stats Wales, Casualties by speed limit and severity, May 2025
Casualties by severity
Collisions data is seasonal and impacted by factors such as traffic volume and weather. It is advisable and meaningful to compare quarterly data with the same quarter in previous years rather than with the previous quarter. However, longer term trends give a better indication of patterns and changes in police recorded road collisions.
Figure 17 shows the number of casualties on public roads in the 12 months before and after the implementation of the 20mph default speed limit. Table 14 contains the quarterly data and compares casualties to the corresponding quarter in the 12 months before the introduction of the 20mph speed limit.
Figure 17: Casualties by severity and quarter, 2023 to 2024
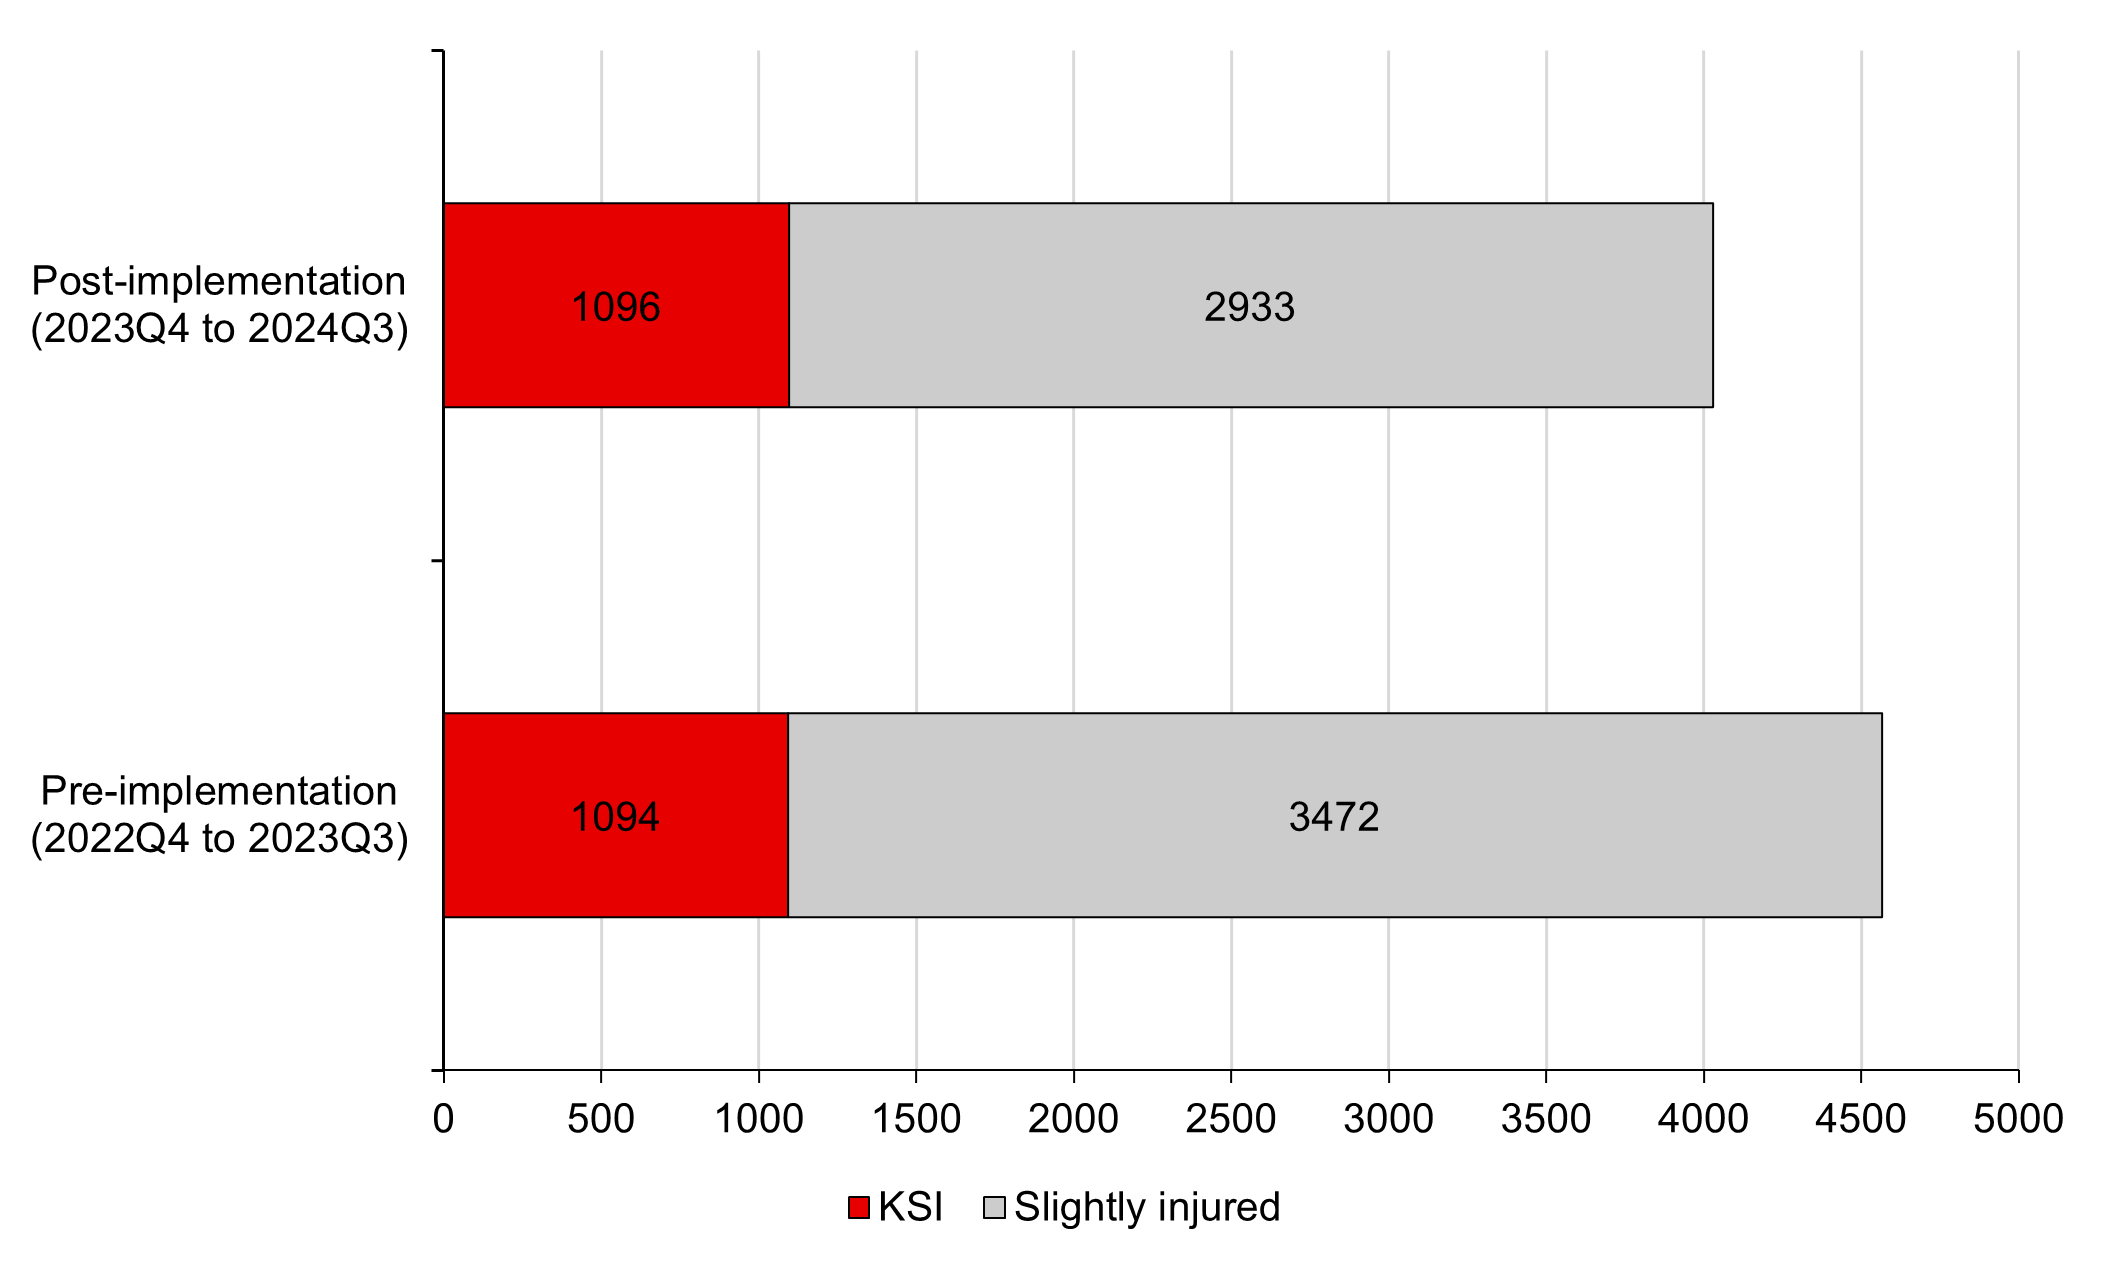
Table 14: Total number of casualties by quarter
| Quarter | Implementation period | Casualties | Year-on-year percentage change |
| 2022 Q4 | Pre-implementation | 1,200 | - |
| 2023 Q1 | Pre-implementation | 968 | - |
| 2023 Q2 | Pre-implementation | 1,138 | - |
| 2023 Q3 | Pre-implementation | 1,260 | - |
| 2023 Q4 | Post-implementation | 983 | -18.1% |
| 2024 Q1 | Post-implementation | 843 | -12.9% |
| 2024 Q2 | Post-implementation | 1,087 | -4.5% |
| 2024 Q3 | Post-implementation | 1,116 | -11.4% |
| 2024 Q4 | Post-implementation | 947 | -21.1% |
| 2022 Q4 - 2023 Q3 | Pre-implementation | 4,566 | - |
| 2023 Q4 - 2024 Q3 | Post-implementation | 4,029 | -11.8% |
(*) Percentage change for 2024 Q4 is compared with 2022 Q4, comparing pre- and post-implementation.
Table 14 highlights a reduction in total casualties in the post-implementation quarters when compared to the same quarter of the year before implementation. Overall, in the first 12 months after the introduction of the 20mph default speed limit, there was a 11.8% decrease in total casualties.
While changes in the proportion of KSI casualties to slightly injured casualties are of interest, these are not analysed here due to the adoption by Dyfed-Powys police of the CRaSH system in May 2023. This change is likely to have increased the relative proportion of KSI casualties in the post-implementation period.
Casualties by road type
As illustrated in table 15, the speed limit on most 30mph roads reduced to 20mph following the introduction of the new default speed limit. The total length of roads with 30mph limits fell from 13,100km to 980km. Therefore, to assess the potential impact of the policy we can assess the trend in the total number of casualties on all roads with a speed limit of 20mph or 30mph since the speed limit on most of these roads was 30mph until 2023 Q3 and 20mph after that.
Table 15: Total 20mph and 30mph road lengths, before and after implementation³⁰
| Period | 20mph roads | 30mph roads | Total |
| Pre-implementation | 870 km | 13,100 km | 13,970 km |
| Post-implementation | 13,000 km | 980 km | 13,980 km |
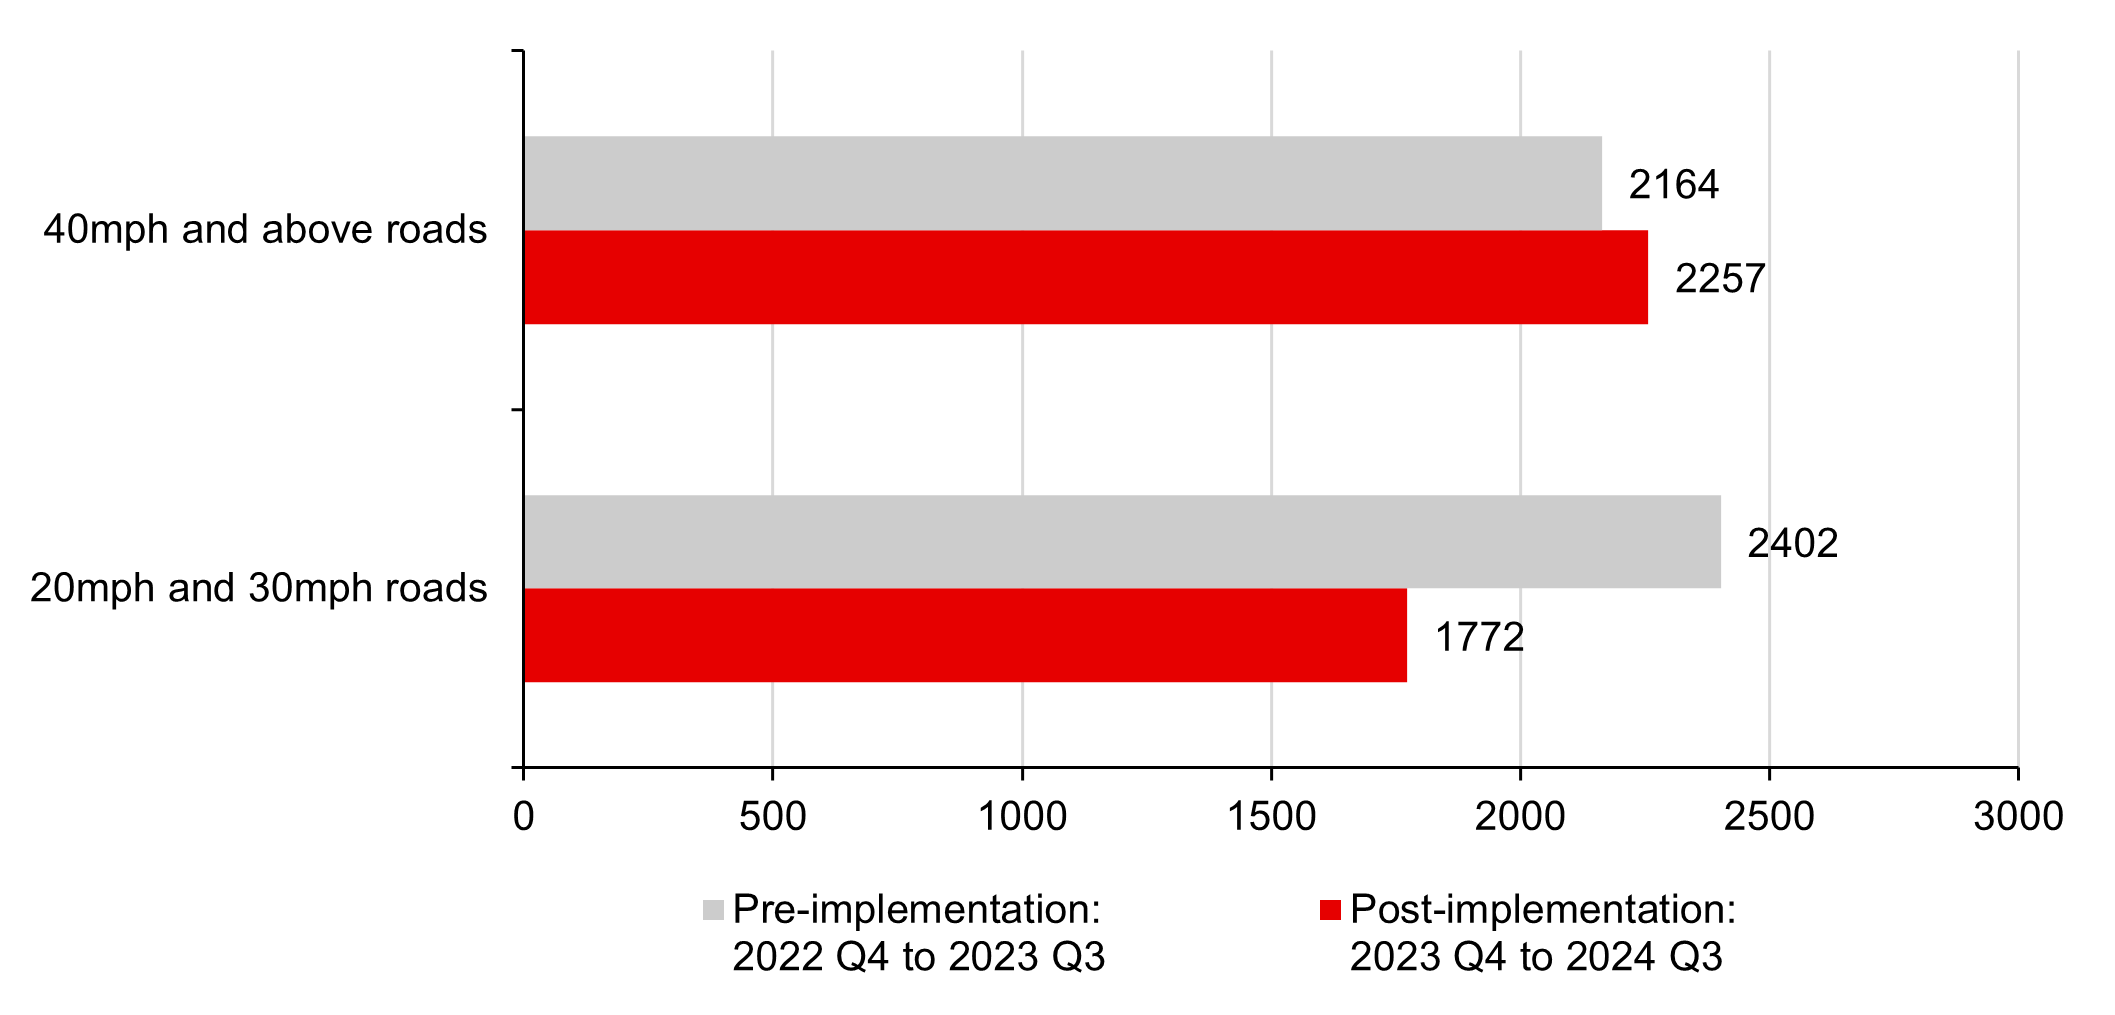
Figure 18 shows casualties on 20mph and 30mph roads combined and roads with speed limits above 40mph. These are annual figures, covering the four quarters before implementation (2022 Q4 to 2023 Q3) and following the 20mph implementation (2023 Q4 to 2024 Q3). The chart shows that casualties on 20mph and 30mph roads fell by 630 ( 26.2%) in the four quarters post-implementation. On roads with a 40mph and above speed limit casualties increased by 93 (+4.2%).
The number of casualties has generally been declining over the last decade.
Figure 18: Casualties by road type, 2023 and 2024³¹
³⁰ Welsh Government, Police recorded road collisions: 2024 (provisional), 2025
³¹ Welsh Government, Casualties by quarter, year and severity, 2025
4. Summary
Table 16: KPI assessment summary (as of May 2025)
| KPI | KPI description | Assessment | Baseline period | Most recent period |
| 1.1 | Percentage travelling at or below 24mph (as a proxy for compliance with the 20mph limit) | Increase from 20.8% (pre-implementation) to 54.0% travelling at or below 24mph | Summer 2023 | Winter 2024/25 |
| 1.2 | Change in 85th percentile speed | 3.4mph reduction in speed | Summer 2023 | Winter 2024/25 |
| 1.3 | Change in mean speed | 3.8mph reduction in speed | Summer 2023 | Winter 2024/25 |
| 1.4 | Vehicle journey times and journey time variability, based on the difference between the 5th and 95th percentile journey times as a proxy for journey time reliability, on main through routes
| Increase in average journey times Decrease in journey time variability (namely, improved journey-time reliability) | Spring 2023 | Autumn 2024 |
| 2.1, 2.2, 2.3 | Reduce the number of pedestrians and cyclists killed or seriously injured on the road network³² | In the first 12 months after the introduction of the default 20mph speed limit, there was a 11.8% decrease in total casualties. Casualties on 20 and 30mph roads decreased by 26.2% while casualties on >40mph roads increased by 4.2%. Lack of sufficient data at this stage to be able to assess trends in pedestrian and cyclist casualties. | 2022 Q4 to 2023 Q3 | 2023 Q4 to 2024 Q3 |
| 3.2 | Change in vehicle and pedestrian yielding behaviours | Inconclusive at this stage, as the changes in yielding behaviours varied between the sites assessed. | 2023 (February to March) | 2025 (February to March) |
| 4.1 | Change in local air quality - NO2 | No material effect identified - however, lack of recent data means no firm conclusions can be drawn at this stage. | May 2023 | April 2024 |
³² Collision data for pedestrians and cyclists cannot yet be meaningfully assessed with less than three years of post-implementation data, following approaches recommended by RoSPA (2002) Road Safety Engineering Manual, RoSPA: London. However, data for the total number of road casualties is presented.
Annex A: Locations for speed monitoring
Annex B: Journey time monitoring routes
Annex C: Additional information
Table 17: Timescales and source locations for monitoring data
| KPI | Areas / sites / routes | Time period | Notes |
1.1: Traffic compliance with 20mph speed limit 1.2: Change in 85th percentile speed 1.3: Change in mean speed
| Lampeter, Penrhyn Bay, Llanrug, Allt-yr-yn (Newport), Pembroke Dock, Newtown, Tylorstown/Pontygwaith, Torfaen (Cwmbran, Pontypool and Blaenavon), Wrexham, Peniel
| Pre-implementation:
Post-implementation:
| |
1.4: Vehicle journey times and journey time variation on main through routes
|
| Pre-implementation:
Post-implementation:
| |
2.1-2.3 Casualty rates for pedestrians and cyclists
| Wales (by police force area)
| Pre-implementation:
Post-implementation:
| This data is only partial given that it is judged that a robust assessment will require 3 years of pre- and post-implementation data, following guidance from RoSPA (2002) Road Safety Engineering Manual, RoSPA: London
|
3.2: Change in vehicle and pedestrian yielding behaviours
| King Street, Abergavenny
| Pre-implementation:
Post-implementation:
| All sites were analysed in phase 1. Three sites marked * are being analysed for the national monitoring programme, as these changed from 30mph to 20mph in September 2023
|
| 4.1: Change in local air quality - NO2 | Cardiff (North) Magor (Severnside) Abergavenny | May 2022 - April 2024 | No new data has been obtained since the last monitoring report was published |
Table 18: Journey times and journey time variability (spring 2023 to autumn 2024)
| Route number | Route | AM or PM | Journey time (spring 2023) | Journey time (autumn 2024) | Change (mm:ss) | Change (%) | Journey time variability (spring 2023) | Journey time variability (autumn 2024) | Change (mm:ss) | Change (%) |
| 1 | Aberystwyth to Cardigan | AM | 01:04:35 | 01:08:23 | +03:48 | 5.9% | 09:11 | 09:02 | -00:09 | -1.3% |
| 1 | Aberystwyth to Cardigan | PM | 01:04:30 | 01:07:46 | +03:16 | 5.1% | 06:34 | 06:33 | -00:01 | 0.3% |
| 1 | Cardigan to Aberystwyth | AM | 01:04:24 | 01:07:39 | +03:15 | 5.0% | 07:38 | 07:45 | +00:07 | 1.5% |
| 1 | Cardigan to Aberystwyth | PM | 01:04:13 | 01:07:19 | +03:06 | 4.8% | 07:30 | 06:36 | -00:54 | -12.0% |
| 2 | Llandudno to Betws-y-coed | AM | 00:29:28 | 00:32:51 | +03:23 | 11.5% | 04:11 | 04:36 | +00:25 | 10.0% |
| 2 | Llandudno to Betws-y-coed | PM | 00:29:51 | 00:33:24 | +03:33 | 11.9% | 03:51 | 04:06 | +00:15 | 6.5% |
| 2 | Betws-y-coed to Llandudno | AM | 00:31:54 | 00:31:46 | -00:08 | -0.4% | 07:18 | 03:49 | -03:29 | -47.7% |
| 2 | Betws-y-coed to Llandudno | PM | 00:31:52 | 00:31:52 | -00:00 | 0.0% | 04:58 | 03:51 | -01:07 | -22.5% |
| 3 | Carmarthen to Coleg Sir Gar | AM | 00:28:55 | 00:31:56 | +03:01 | 10.4% | 03:53 | 04:18 | +00:25 | 10.7% |
| 3 | Carmarthen to Coleg Sir Gar | PM | 00:28:48 | 00:31:30 | +02:42 | 9.4% | 03:21 | 04:21 | +01:00 | 29.9% |
| 3 | Coleg Sir Gar to Carmarthen | AM | 00:28:55 | 00:31:13 | +02:18 | 8.0% | 03:00 | 04:40 | +01:40 | 55.6% |
| 3 | Coleg Sir Gar to Carmarthen | PM | 00:28:52 | 00:31:44 | +02:52 | 9.9% | 02:42 | 04:24 | +01:42 | 63.0% |
| 4 | Porthmadog to Caernarfon | AM | 00:29:32 | 00:30:47 | +01:15 | 4.2% | 03:59 | 03:38 | -00:21 | -8.8% |
| 4 | Porthmadog to Caernarfon | PM | 00:30:06 | 00:30:50 | +00:44 | 2.4% | 07:34 | 03:57 | -03:37 | -47.8% |
| 4 | Caernarfon to Porthmadog | AM | 00:29:58 | 00:31:38 | +01:40 | 5.6% | 04:11 | 03:45 | -00:26 | -10.4% |
| 4 | Caernarfon to Porthmadog | PM | 00:30:14 | 00:31:26 | +01:12 | 4.0% | 06:01 | 03:24 | -02:37 | -43.5% |
| 5 | Caerphilly to Newport | AM | 00:27:07 | 00:30:02 | +02:55 | 10.8% | 07:52 | 05:49 | -02:03 | -26.1% |
| 5 | Caerphilly to Newport | PM | 00:26:50 | 00:28:43 | +01:53 | 7.0% | 05:17 | 03:41 | -01:36 | -30.3% |
| 5 | Newport to Caerphilly | AM | 00:25:36 | 00:28:34 | +02:58 | 11.6% | 05:00 | 04:49 | -00:11 | -3.7% |
| 5 | Newport to Caerphilly | PM | 00:28:58 | 00:30:32 | +01:34 | 5.4% | 10:28 | 06:10 | -04:18 | -41.1% |
| 6 | Wrexham to Deeside | AM | 00:27:10 | 00:28:45 | +01:35 | 5.8% | 09:32 | 06:00 | -03:32 | -37.1% |
| 6 | Wrexham to Deeside | PM | 00:27:38 | 00:29:21 | +01:43 | 6.2% | 07:14 | 05:22 | -01:52 | -25.8% |
| 6 | Deeside to Wrexham | AM | 00:28:42 | 00:29:32 | +00:50 | 2.9% | 11:12 | 06:06 | -05:06 | -45.5% |
| 6 | Deeside to Wrexham | PM | 00:28:28 | 00:29:34 | +01:06 | 3.9% | 07:21 | 04:47 | -02:34 | -34.9% |
| 7 | St Davids to Haverfordwest | AM | 00:27:22 | 00:27:54 | +00:32 | 1.9% | 05:07 | 04:57 | -00:10 | -3.3% |
| 7 | St Davids to Haverfordwest | PM | 00:27:41 | 00:28:00 | +00:19 | 1.1% | 04:32 | 03:47 | -00:45 | -16.5% |
| 7 | Haverfordwest to St Davids | AM | 00:27:33 | 00:28:19 | +00:46 | 2.8% | 04:32 | 03:45 | -00:47 | -17.3% |
| 7 | Haverfordwest to St Davids | PM | 00:27:34 | 00:28:13 | +00:39 | 2.4% | 04:34 | 04:53 | +00:19 | 6.9% |
| 8 | Ystrad Mynach to Crosskeys | AM | 00:17:07 | 00:18:43 | +01:36 | 9.3% | 04:12 | 03:12 | -01:00 | -23.8% |
| 8 | Ystrad Mynach to Crosskeys | PM | 00:17:12 | 00:19:01 | +01:49 | 10.6% | 03:20 | 03:38 | +00:18 | 9.0% |
| 8 | Crosskeys to Ystrad Mynach | AM | 00:18:10 | 00:19:33 | +01:23 | 7.6% | 06:18 | 04:28 | -01:50 | -29.1% |
| 8 | Crosskeys to Ystrad Mynach | PM | 00:18:27 | 00:20:15 | +01:48 | 9.8% | 05:10 | 04:17 | -00:53 | -17.1% |
| 9 | Sketty to Morriston | AM | 00:17:01 | 00:17:43 | +00:42 | 4.1% | 06:22 | 03:35 | -02:47 | -43.7% |
| 9 | Sketty to Morriston | PM | 00:18:19 | 00:18:26 | +00:07 | 0.6% | 05:30 | 03:22 | -02:08 | -38.8% |
| 9 | Morriston to Sketty | AM | 00:18:23 | 00:18:25 | +00:02 | 0.2% | 05:42 | 03:59 | -01:43 | -30.1% |
| 9 | Morriston to Sketty | PM | 00:18:30 | 00:18:42 | +00:12 | 1.1% | 04:52 | 03:23 | -01:29 | -30.5% |
| 10 | Pontypool to Blaenavon | AM | 00:14:00 | 00:15:11 | +01:11 | 8.5% | 02:37 | 02:23 | -00:14 | -8.9% |
| 10 | Pontypool to Blaenavon | PM | 00:14:57 | 00:15:57 | +01:00 | 6.7% | 03:44 | 03:40 | -00:04 | -1.8% |
| 10 | Blaenavon to Pontypool | AM | 00:14:29 | 00:16:31 | +02:02 | 14.0% | 05:50 | 05:51 | +00:01 | 0.3% |
| 10 | Blaenavon to Pontypool | PM | 00:12:48 | 00:14:09 | +01:21 | 10.5% | 01:57 | 02:14 | +00:17 | 14.5% |
| 11 | Bangor-on-Dee to Wrexham Maelor | AM | 00:14:14 | 00:14:48 | +00:34 | 4.0% | 04:21 | 02:42 | -01:39 | -37.9% |
| 11 | Bangor-on-Dee to Wrexham Maelor | PM | 00:14:31 | 00:14:58 | +00:27 | 3.1% | 03:34 | 02:26 | -01:08 | -31.8% |
| 11 | Wrexham Maelor to Bangor-on-Dee | AM | 00:15:17 | 00:15:52 | +00:35 | 3.8% | 03:31 | 02:35 | -00:56 | -26.5% |
| 11 | Wrexham Maelor to Bangor-on-Dee | PM | 00:15:44 | 00:16:15 | +00:31 | 3.3% | 03:32 | 02:30 | -01:02 | -29.2% |
| 12 | Barry Hospital to Dinas Powys | AM | 00:14:18 | 00:14:22 | +00:04 | 0.5% | 04:59 | 02:23 | -02:36 | -52.2% |
| 12 | Barry Hospital to Dinas Powys | PM | 00:13:17 | 00:13:54 | +00:37 | 4.6% | 02:25 | 01:42 | -00:43 | -29.7% |
| 12 | Dinas Powys to Barry Hospital | AM | 00:13:03 | 00:13:31 | +00:28 | 3.6% | 03:00 | 01:51 | -01:09 | -38.3% |
| 12 | Dinas Powys to Barry Hospital | PM | 00:13:55 | 00:14:33 | +00:38 | 4.6% | 04:12 | 03:08 | -01:04 | -25.4% |
| 13 | St Asaph to Denbigh | AM | 00:12:33 | 00:14:00 | +01:27 | 11.6% | 03:31 | 02:57 | -00:34 | -16.1% |
| 13 | St Asaph to Denbigh | PM | 00:12:30 | 00:13:38 | +01:08 | 9.1% | 02:28 | 02:26 | -00:02 | -1.4% |
| 13 | Denbigh to St Asaph | AM | 00:13:02 | 00:14:07 | +01:05 | 8.3% | 03:15 | 02:35 | -00:40 | -20.5% |
| 13 | Denbigh to St Asaph | PM | 00:12:48 | 00:14:10 | +01:22 | 10.7% | 02:25 | 02:30 | +00:05 | 3.4% |
| 14 | Treforest to Nantgarw | AM | 00:12:04 | 00:13:39 | +01:35 | 13.1% | 04:06 | 04:14 | +00:08 | 3.3% |
| 14 | Treforest to Nantgarw | PM | 00:13:47 | 00:13:27 | -00:20 | -2.4% | 06:09 | 03:55 | -02:14 | -36.3% |
| 14 | Nantgarw to Treforest | AM | 00:10:01 | 00:11:00 | +00:59 | 9.8% | 02:01 | 01:59 | -00:02 | -1.7% |
| 14 | Nantgarw to Treforest | PM | 00:11:12 | 00:11:35 | +00:23 | 3.4% | 03:44 | 02:20 | -01:24 | -37.5% |
| 15 | Coedpoeth to Wrexham Maelor | AM | 00:08:20 | 00:09:37 | +01:17 | 15.4% | 03:40 | 03:56 | +00:16 | 7.3% |
| 15 | Coedpoeth to Wrexham Maelor | PM | 00:07:50 | 00:08:55 | +01:05 | 13.8% | 01:56 | 01:57 | +00:01 | 0.9% |
| 15 | Wrexham Maelor to Coedpoeth | AM | 00:07:53 | 00:08:46 | +00:53 | 11.2% | 02:09 | 01:55 | -00:14 | -10.9% |
| 15 | Wrexham Maelor to Coedpoeth | PM | 00:08:46 | 00:09:35 | +00:49 | 9.3% | 03:04 | 02:14 | -00:50 | -27.2% |